 Article fact-checked
-
The global chatbot market is projected to grow from $1.42 billion in 2025 to $7.96 billion by 2035, representing nearly a sixfold increase and confirming sustained long-term expansion rather than short-term hype.
-
Market growth remains highly consistent, with the chatbot market CAGR holding close to 19% between 2026 and 2034, before moderating to 14.37% in 2035, signaling gradual market maturation rather than slowdown.
-
Usage is highly concentrated, as ChatGPT accounts for 81.20% of the AI chatbot market share worldwide, while all other platforms combined represent less than 19%, highlighting highly concentrated market dynamics.
-
User-side adoption is driven by convenience and speed: 62% of consumers prefer chatbots over waiting for human agents, and 72% expect instant messaging support, indicating that chatbots are becoming a baseline digital expectation.
-
Business adoption scales with company size, with 91% of large businesses (50+ employees) and 78% of global enterprises using chatbots, compared with 63% of B2B companies and 42% of B2C brands, revealing clear adoption gaps by segment.
-
Operational impact is substantial, as chatbots reduce first-response time by 90%, cut average handling time by 35%, and eliminate queues in 79% of interactions, directly reshaping customer support efficiency.
-
Automation meaningfully reduces workload and costs, with chatbots handling 80% of routine questions, reducing support labor hours by 28%, and lowering customer service costs by 30%, positioning chatbots as a structural cost-control mechanism.
-
Commercial outcomes extend beyond efficiency, as 58% of businesses report increased sales after chatbot adoption, supported by 38% higher website conversions, 29% lower cart abandonment, and a 15% increase in average order value (AOV), linking automation directly to revenue performance.
AI chatbots have moved far beyond simple website assistants and are now reshaping how companies operate, compete, and interact with customers. What was once viewed as an experimental automation tool has quickly become a core part of digital strategies across customer support, sales, and internal operations.
This article brings together the most important chatbot statistics to explain what is really happening behind the rapid adoption of conversational AI. Using up-to-date data, it explores how the global chatbot market is growing, which platforms dominate usage, how users perceive chatbot interactions, and why businesses are increasingly relying on automation to reduce costs and improve performance.
Rather than focusing on hype, the analysis breaks down measurable outcomes: market size and growth rates, adoption across different business types, response-time improvements, cost savings, and revenue-adjacent efficiency gains. The result is a data-driven overview of where chatbots deliver real value today and what their expanding role means for companies planning to scale customer-facing operations in the coming years.
AI chatbot market share worldwide: Leading platforms and competitive landscape
The chart below illustrates the AI chatbot market share, highlighting how total usage is concentrated among a small number of leading chatbot platforms. It provides a clear comparison of market share percentages across major AI chatbots, showing the gap between the dominant player and smaller competitors.
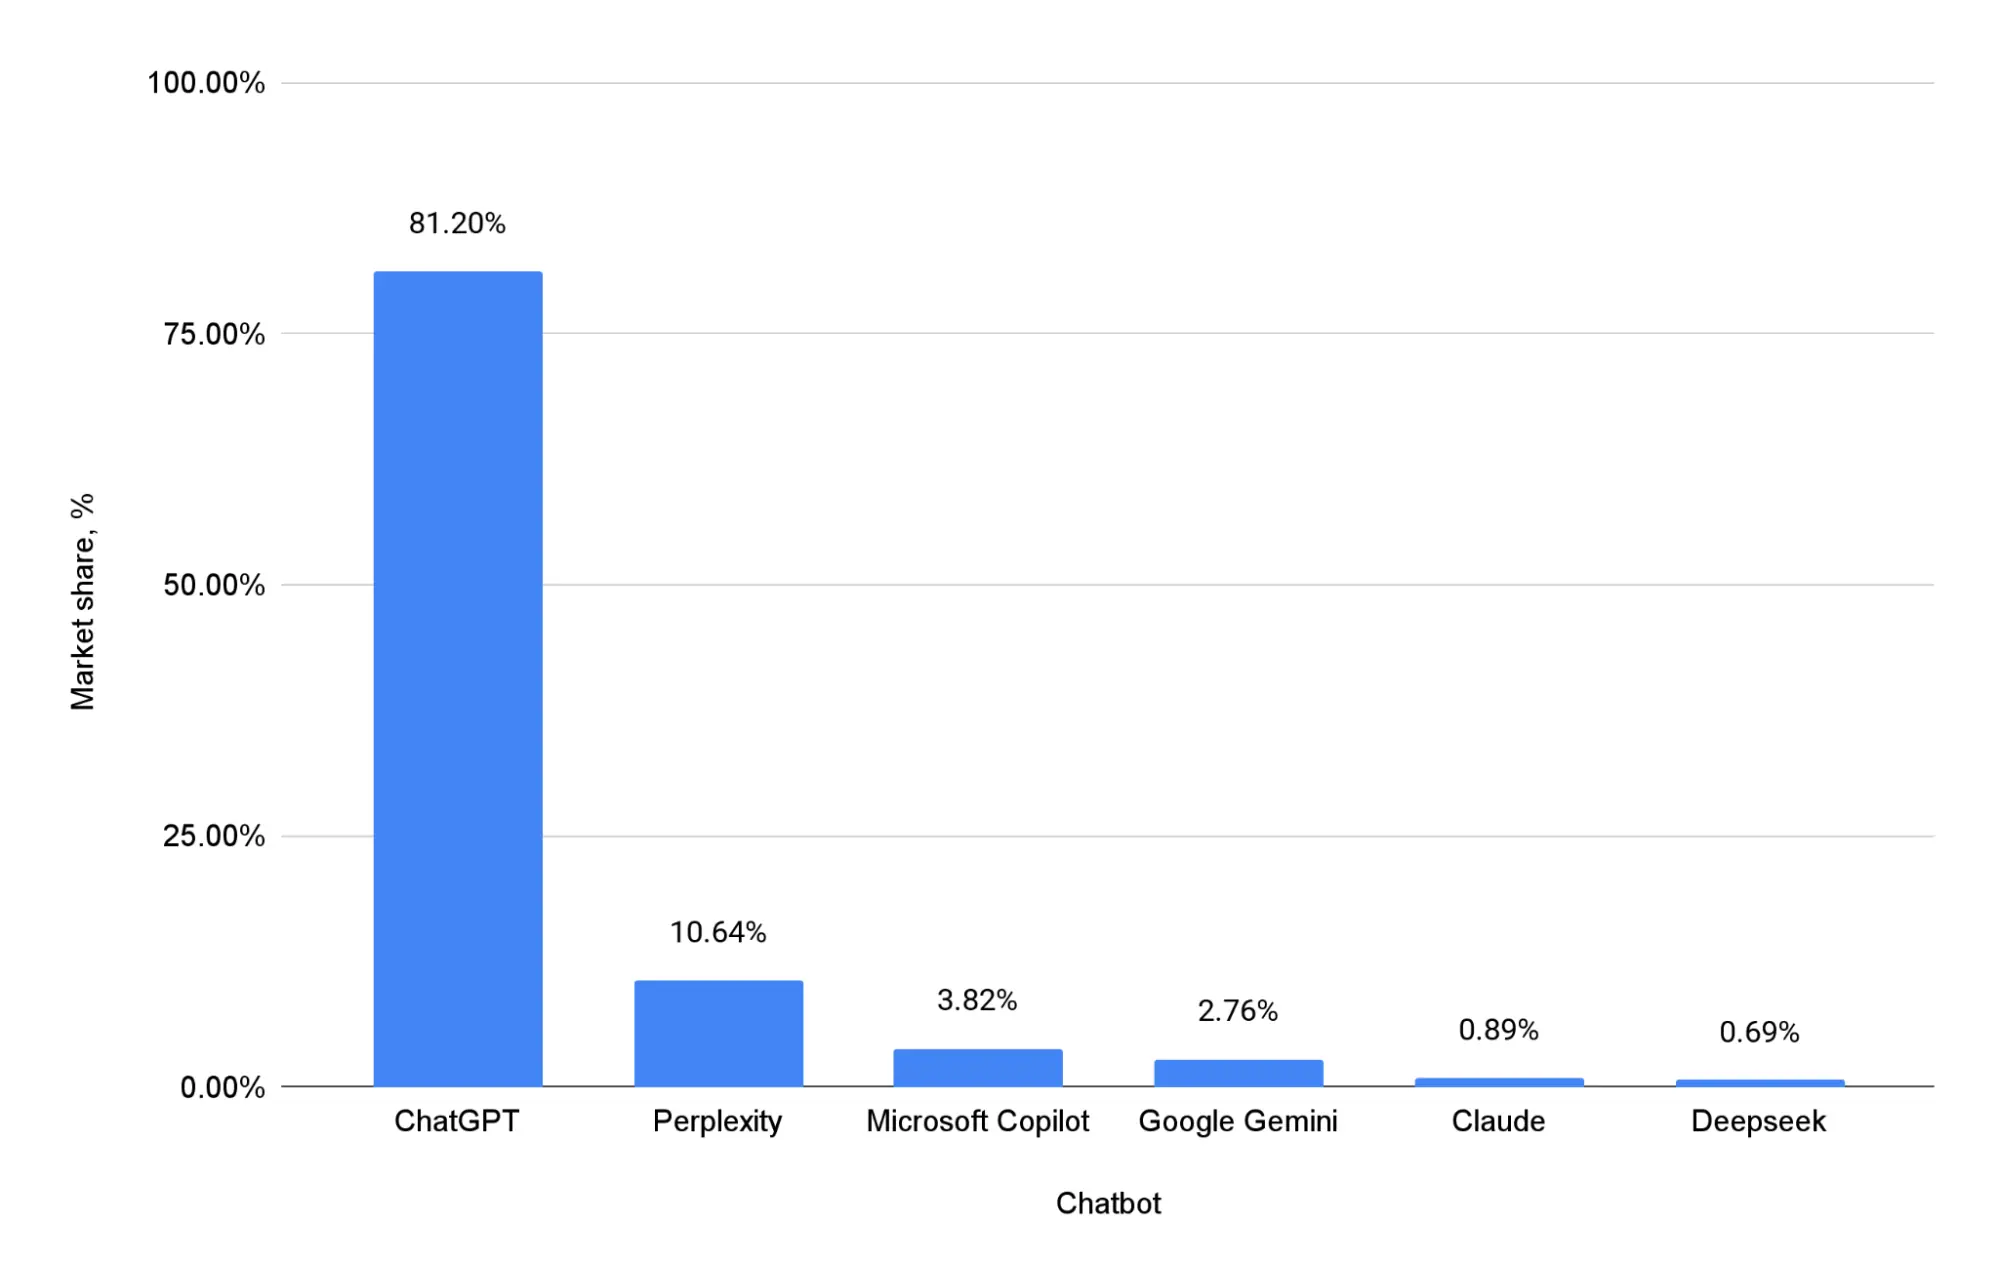
- ChatGPT dominates the AI chatbot market share worldwide with 81.20%, accounting for more than four-fifths of total global usage.
- Perplexity holds 10.64% market share, making it the only competitor with a double-digit presence.
- All remaining platforms combined account for less than 9%, with Microsoft Copilot at 3.82%, Google Gemini at 2.76%, and others each below 1%.
AI chatbot market share worldwide by platform
The AI chatbot market share worldwide is highly concentrated, with a single platform capturing the vast majority of users. This level of dominance suggests the presence of network effects and brand recognition, making it difficult for smaller chatbots to gain a meaningful share. At the same time, the presence of multiple niche competitors indicates ongoing experimentation and differentiation, even within a market clearly led by a single player.
While market share data shows how usage is distributed among leading platforms, understanding the chatbot market size provides a clearer picture of the industry’s overall scale and long-term growth potential.
Chatbot market size and long-term growth outlook
The chart below illustrates the chatbot market size over time, showing projected growth in market value from 2025 through 2035. This visualization helps contextualize broader chatbot trends and chatbot growth statistics by translating adoption and usage into dollar-based market expansion.
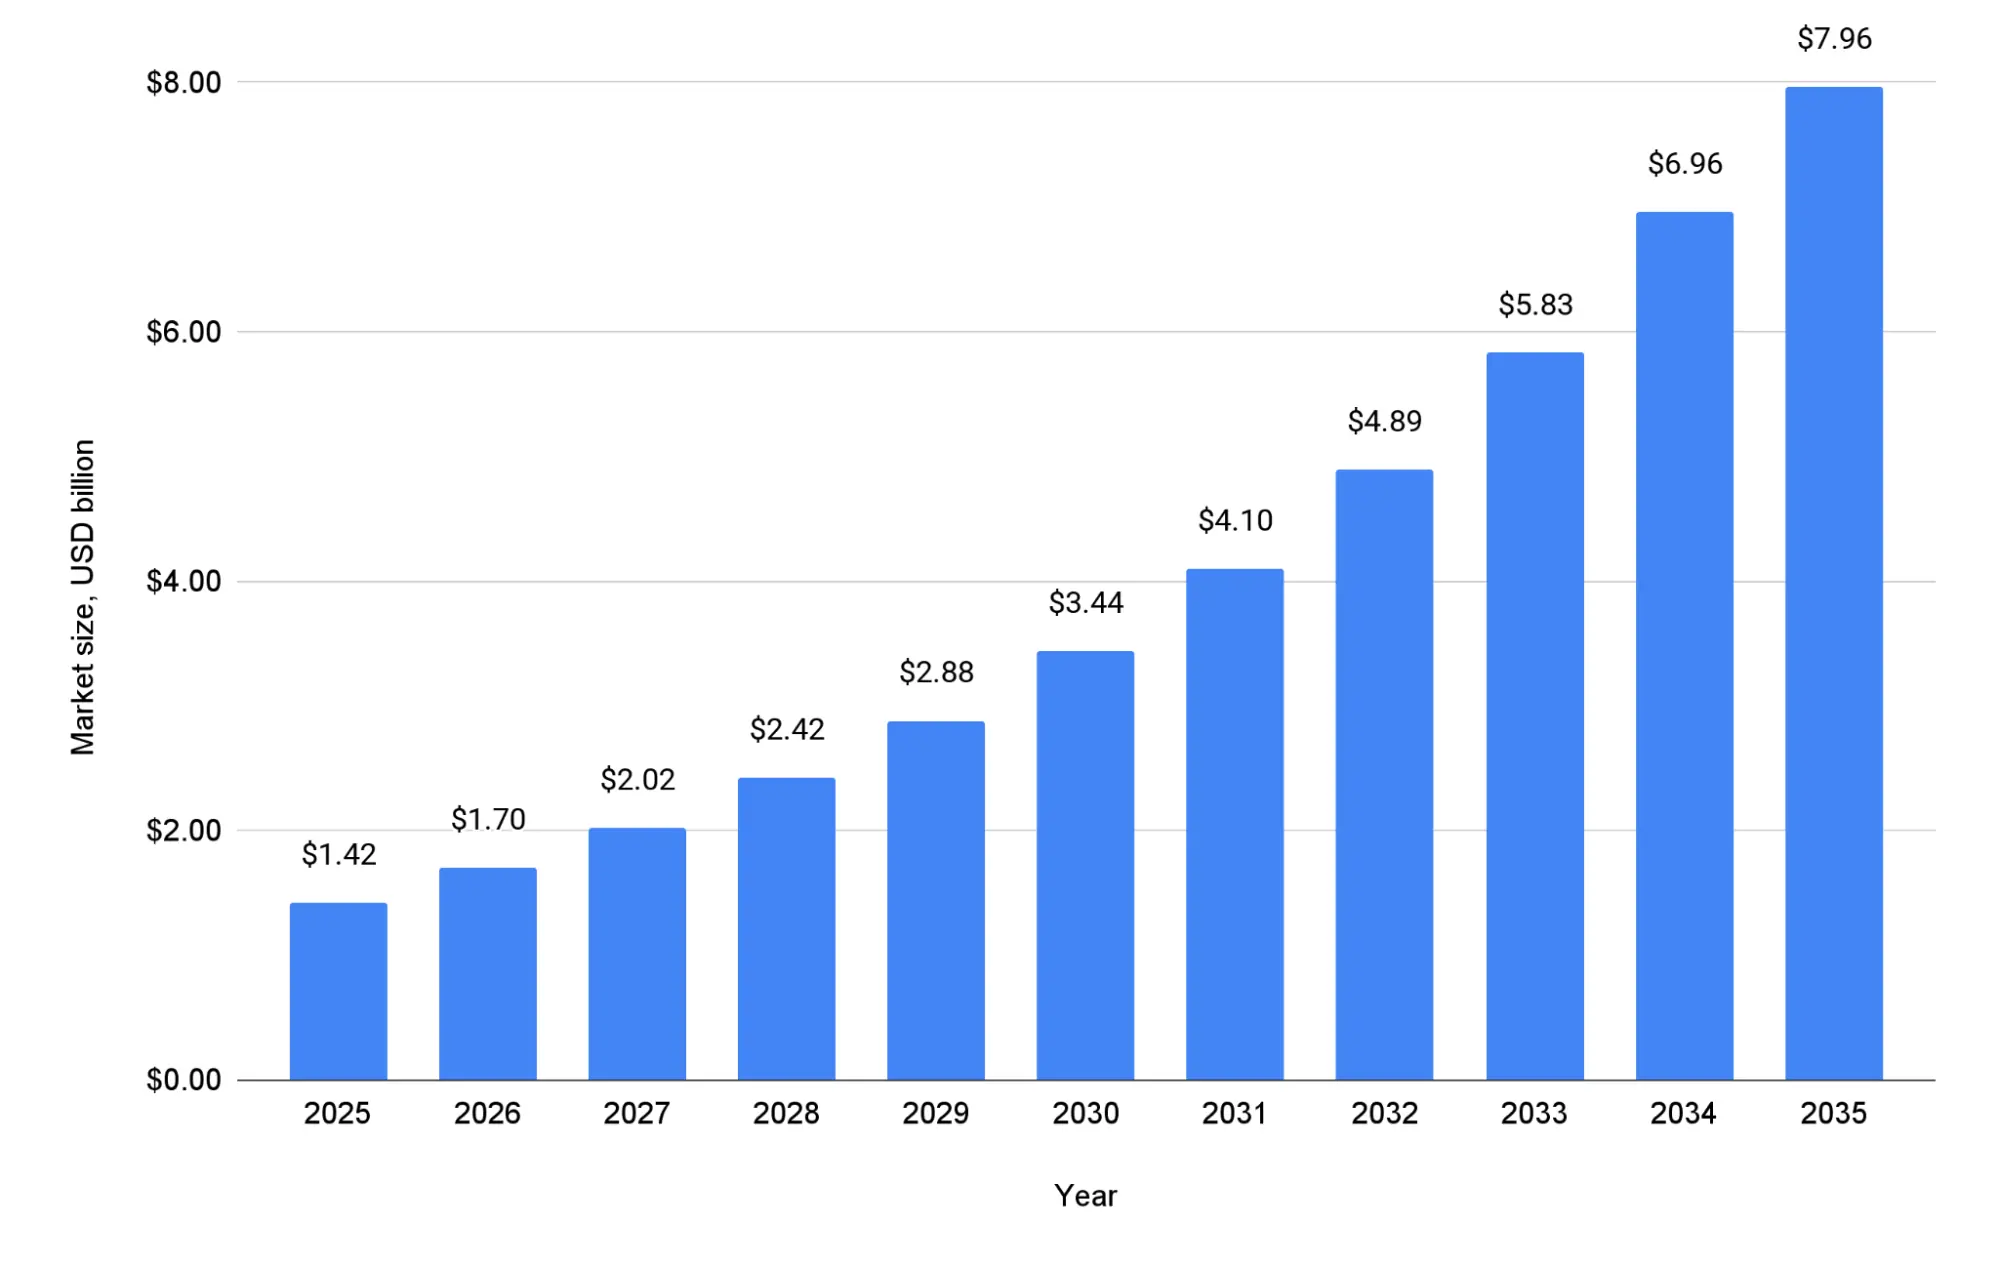
- The chatbot market is projected to grow from $1.42 billion in 2025 to $3.44 billion by 2030, more than doubling in five years.
- Between 2025 and 2035, the global chatbot market will expand nearly sixfold, reaching $7.96 billion.
- Annual growth remains consistent, with market value increasing by at least $0.28–$1.00 billion per year across the forecast period.
Global chatbot market size and growth trends
These figures highlight sustained chatbot growth rather than short-term hype, with steady year-over-year expansion throughout the next decade. The long-term trajectory supports broader chatbot trends, indicating rising enterprise investment and continued product maturity. From a strategic perspective, the data also helps answer how much a chatbot is worth, positioning the technology as a rapidly scaling segment within the wider AI economy.
After examining how the chatbot market expands in absolute value, the next step is to look at the chatbot growth rate to understand how quickly the market is scaling year over year.
Chatbot market growth rate and long-term expansion trends
The chart below presents chatbot growth statistics, showing the annual market size growth rate from 2026 to 2035. This view complements chatbot market size data by highlighting the pace of expansion behind broader chatbot trends and long-term investment momentum.
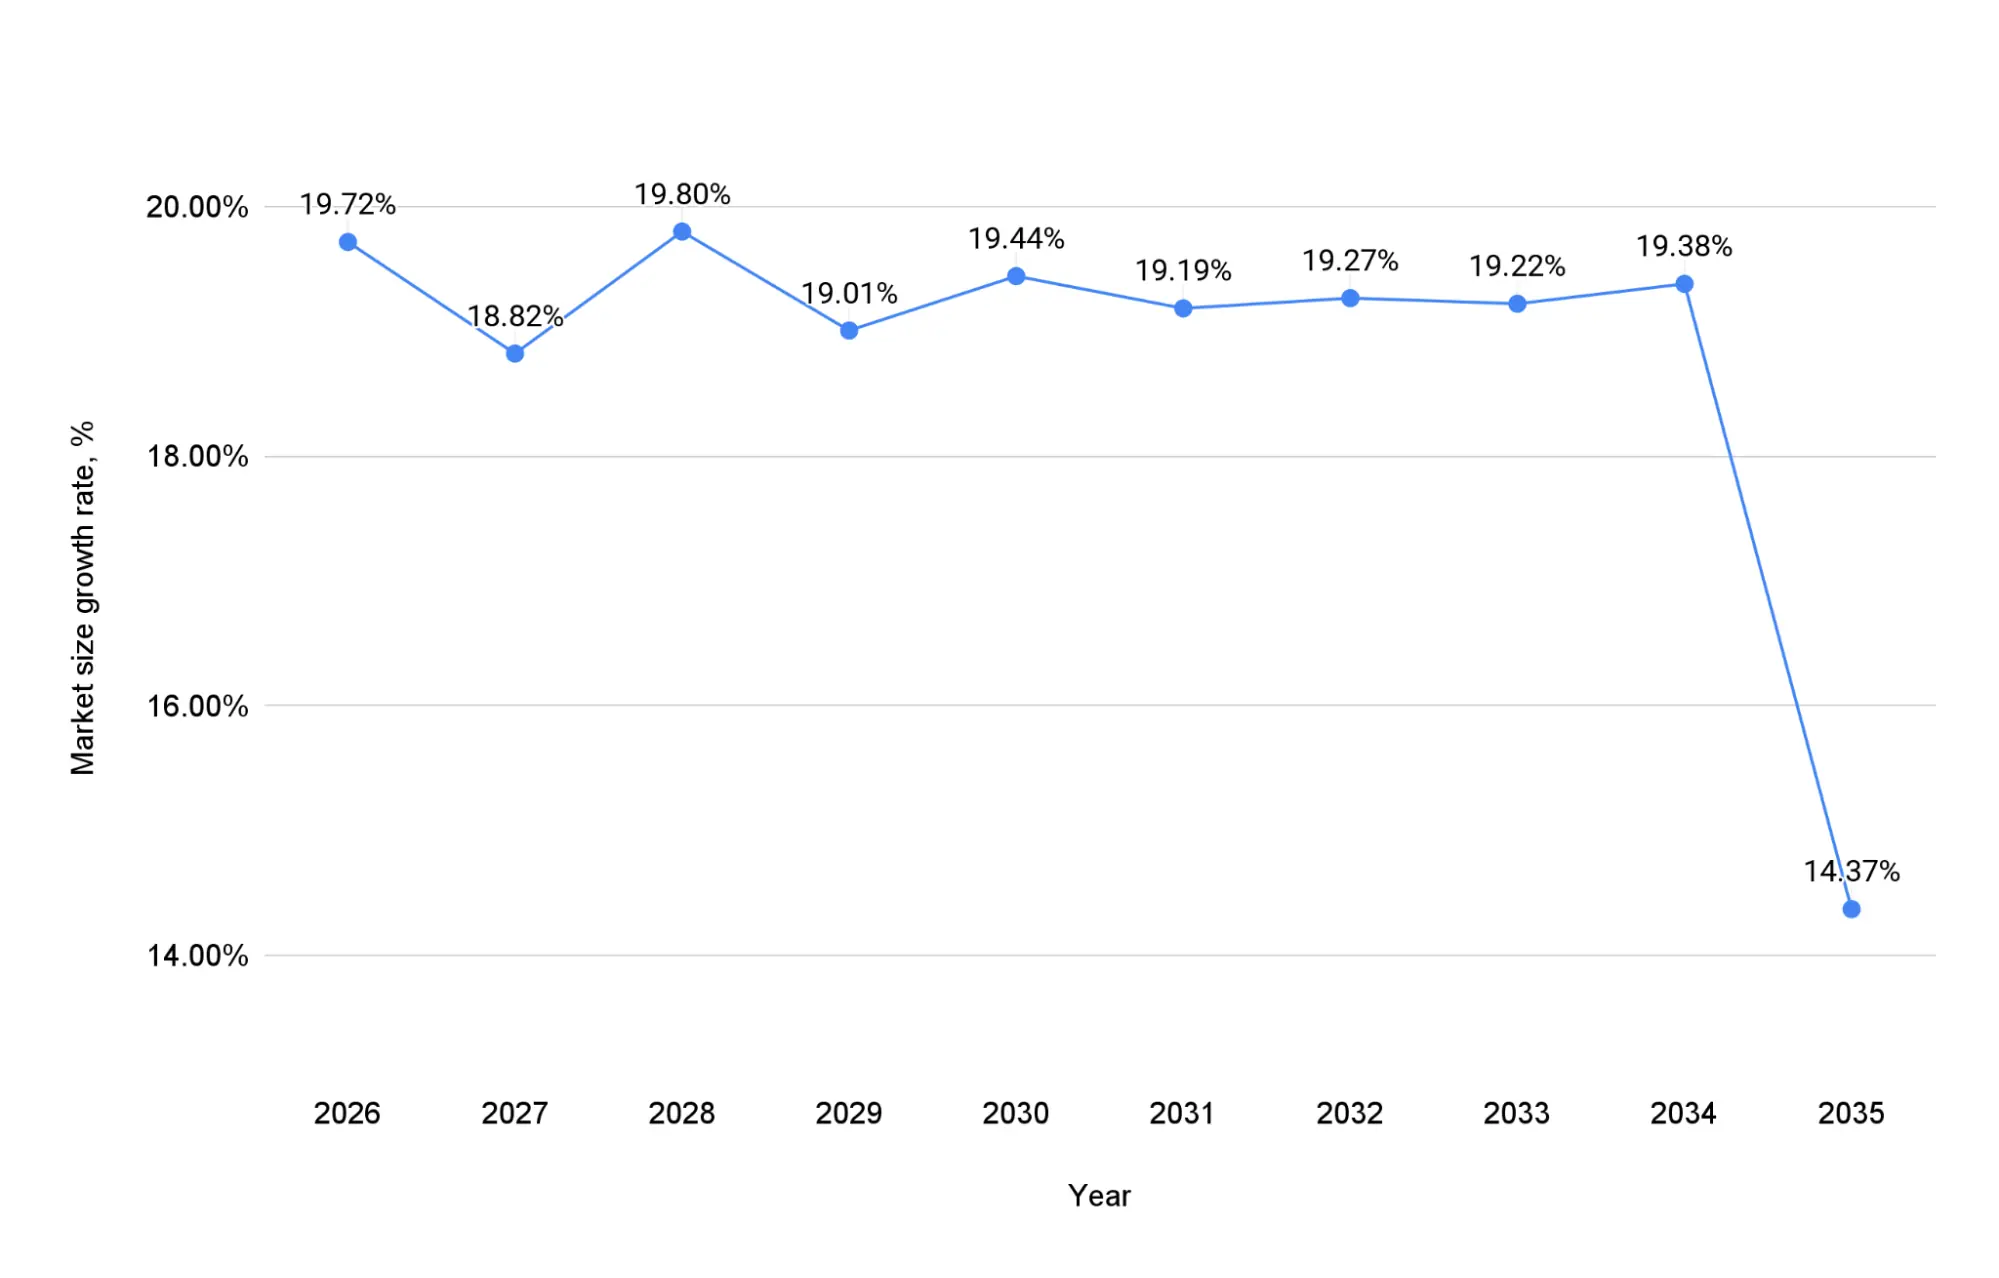
- From 2026 through 2034, the chatbot growth rate remains highly stable, fluctuating narrowly between 18.82% and 19.80%.
- It effectively stays near 19%, based on year-over-year growth rates for nine consecutive years, indicating sustained and predictable growth.
- In 2035, growth moderates to 14.37%, signaling market maturation after a prolonged high-growth phase.
Chatbot growth statistics
These chatbot growth statistics point to a market characterized by long-term consistency rather than volatile spikes. Sustained near-19% expansion aligns with broader chatbot trends, suggesting continued adoption across industries and use cases. Taken together with chatbot market size projections, the data reinforces the view that the global chatbot market is transitioning from rapid expansion toward a more mature, yet still fast-growing, phase.
While chatbot growth statistics explain how fast the market is expanding, chatbot usage statistics reveal how users actually interact with chatbots and why adoption continues to accelerate.
Global chatbot user preferences and adoption signals
The chart below highlights global chatbot user preferences, offering insight into how consumers perceive chatbot interactions across speed, availability, and use-case complexity. These indicators help contextualize broader chatbot adoption statistics by showing what drives real-world usage beyond simple availability.
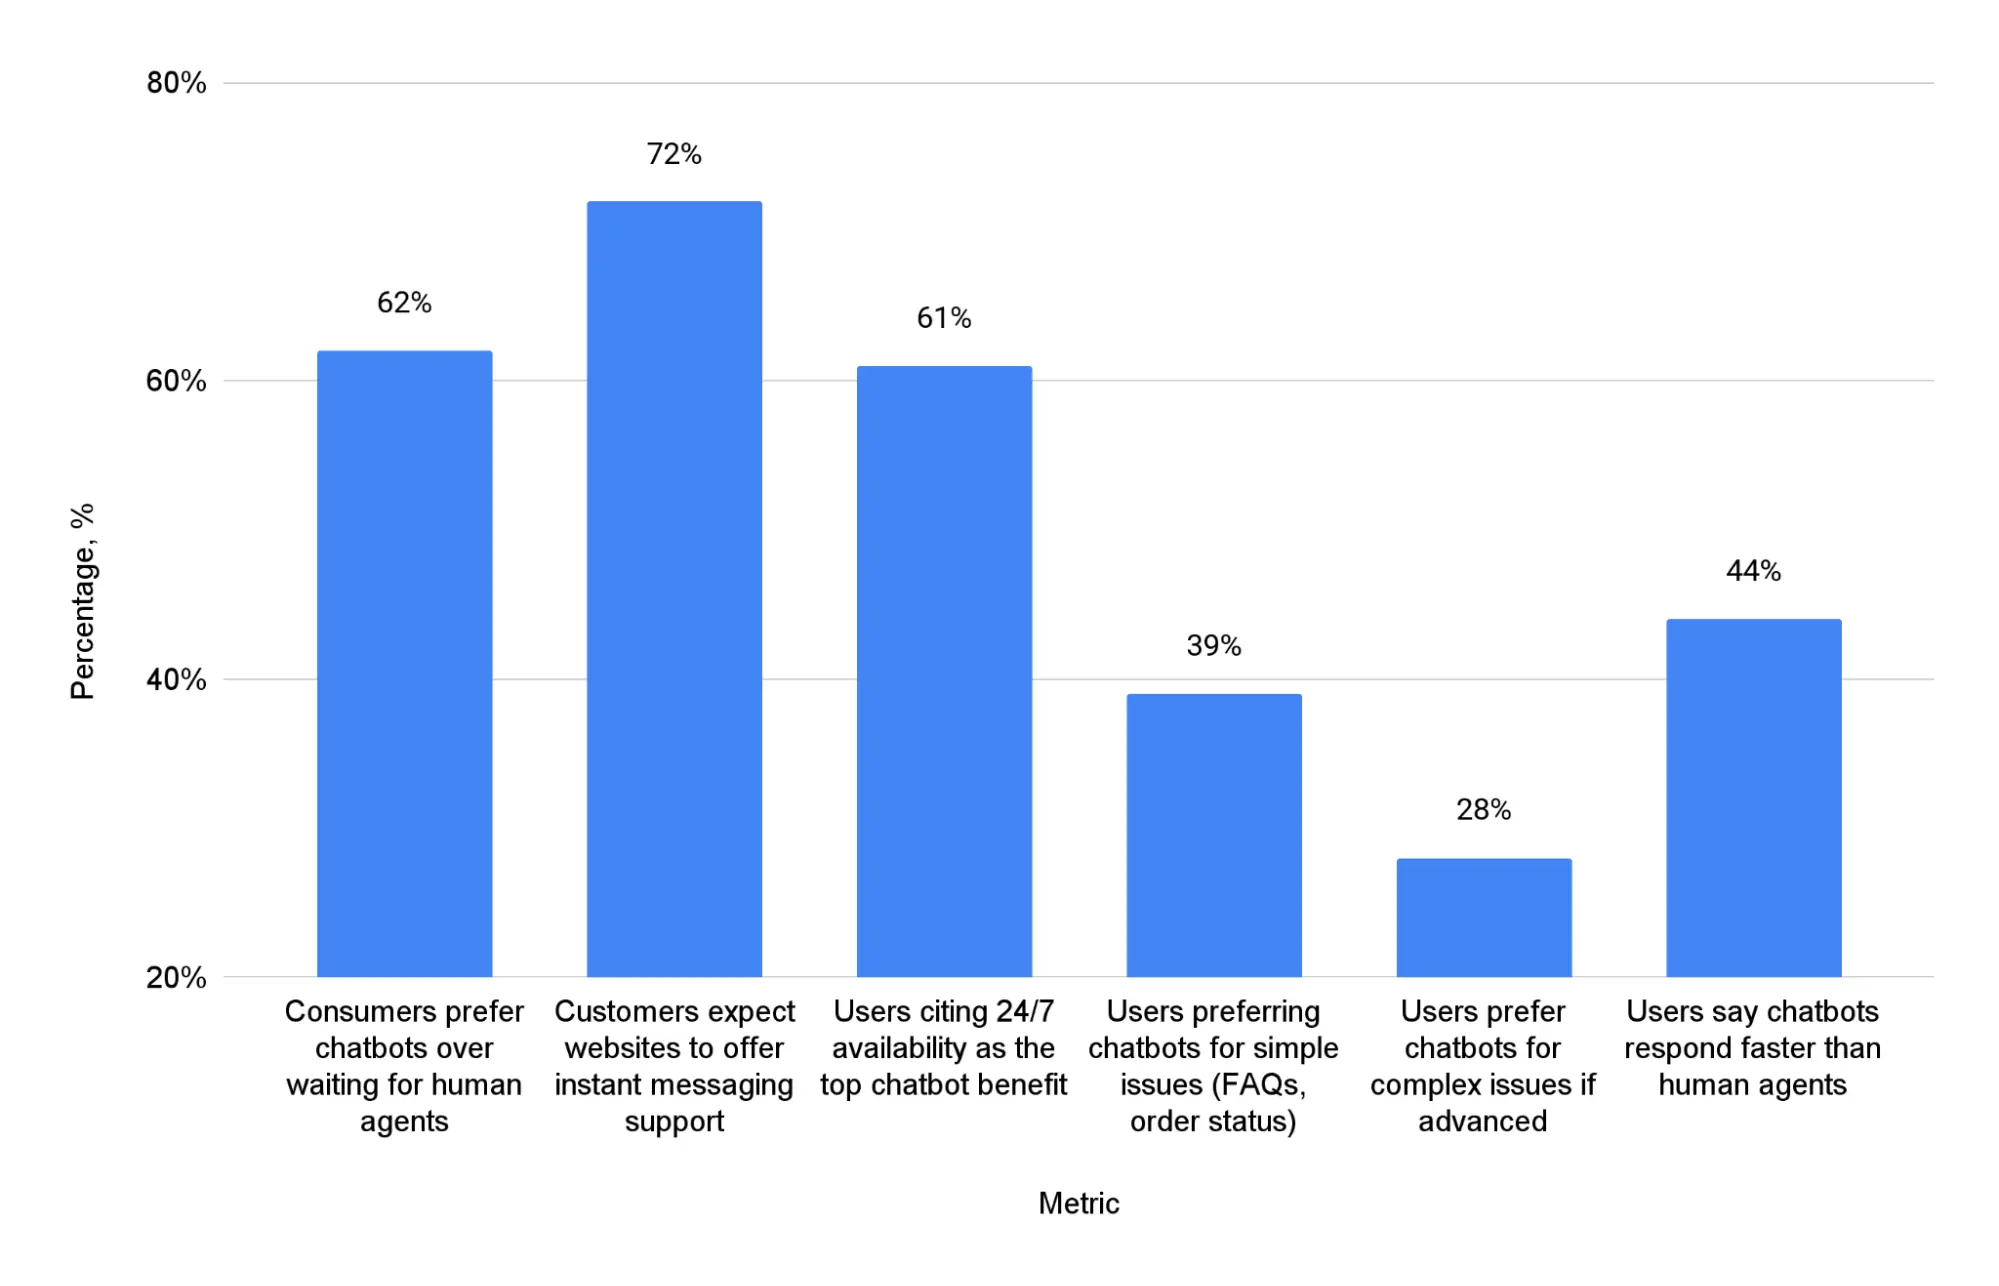
- 62% of consumers prefer chatbots over waiting for human agents, underscoring strong user acceptance and reinforcing global chatbot adoption rates.
- 72% of customers expect websites to offer instant messaging support, signaling that chatbots are increasingly viewed as a standard digital feature rather than an add-on.
- While 39% prefer chatbots for simple issues, a notable 28% are willing to use chatbots for complex issues if the technology is sufficiently advanced.
Who uses chatbots: Global user preferences and adoption behavior
These chatbot usage statistics show that user expectations are shifting toward immediacy, availability, and automation-first interactions. The data also helps answer who uses chatbots, revealing that adoption is driven primarily by convenience and responsiveness rather than novelty.
While user preferences explain why chatbot adoption is growing, experience quality metrics show whether chatbots actually meet user expectations in real-world interactions.
Chatbot experience quality and user satisfaction
The chart below focuses on chatbot experience quality, measuring how users evaluate chatbot interactions in terms of satisfaction, frustration reduction, and overall usability. These indicators complement broader chatbot usage statistics by highlighting not just adoption, but the quality of experiences that sustain long-term usage.
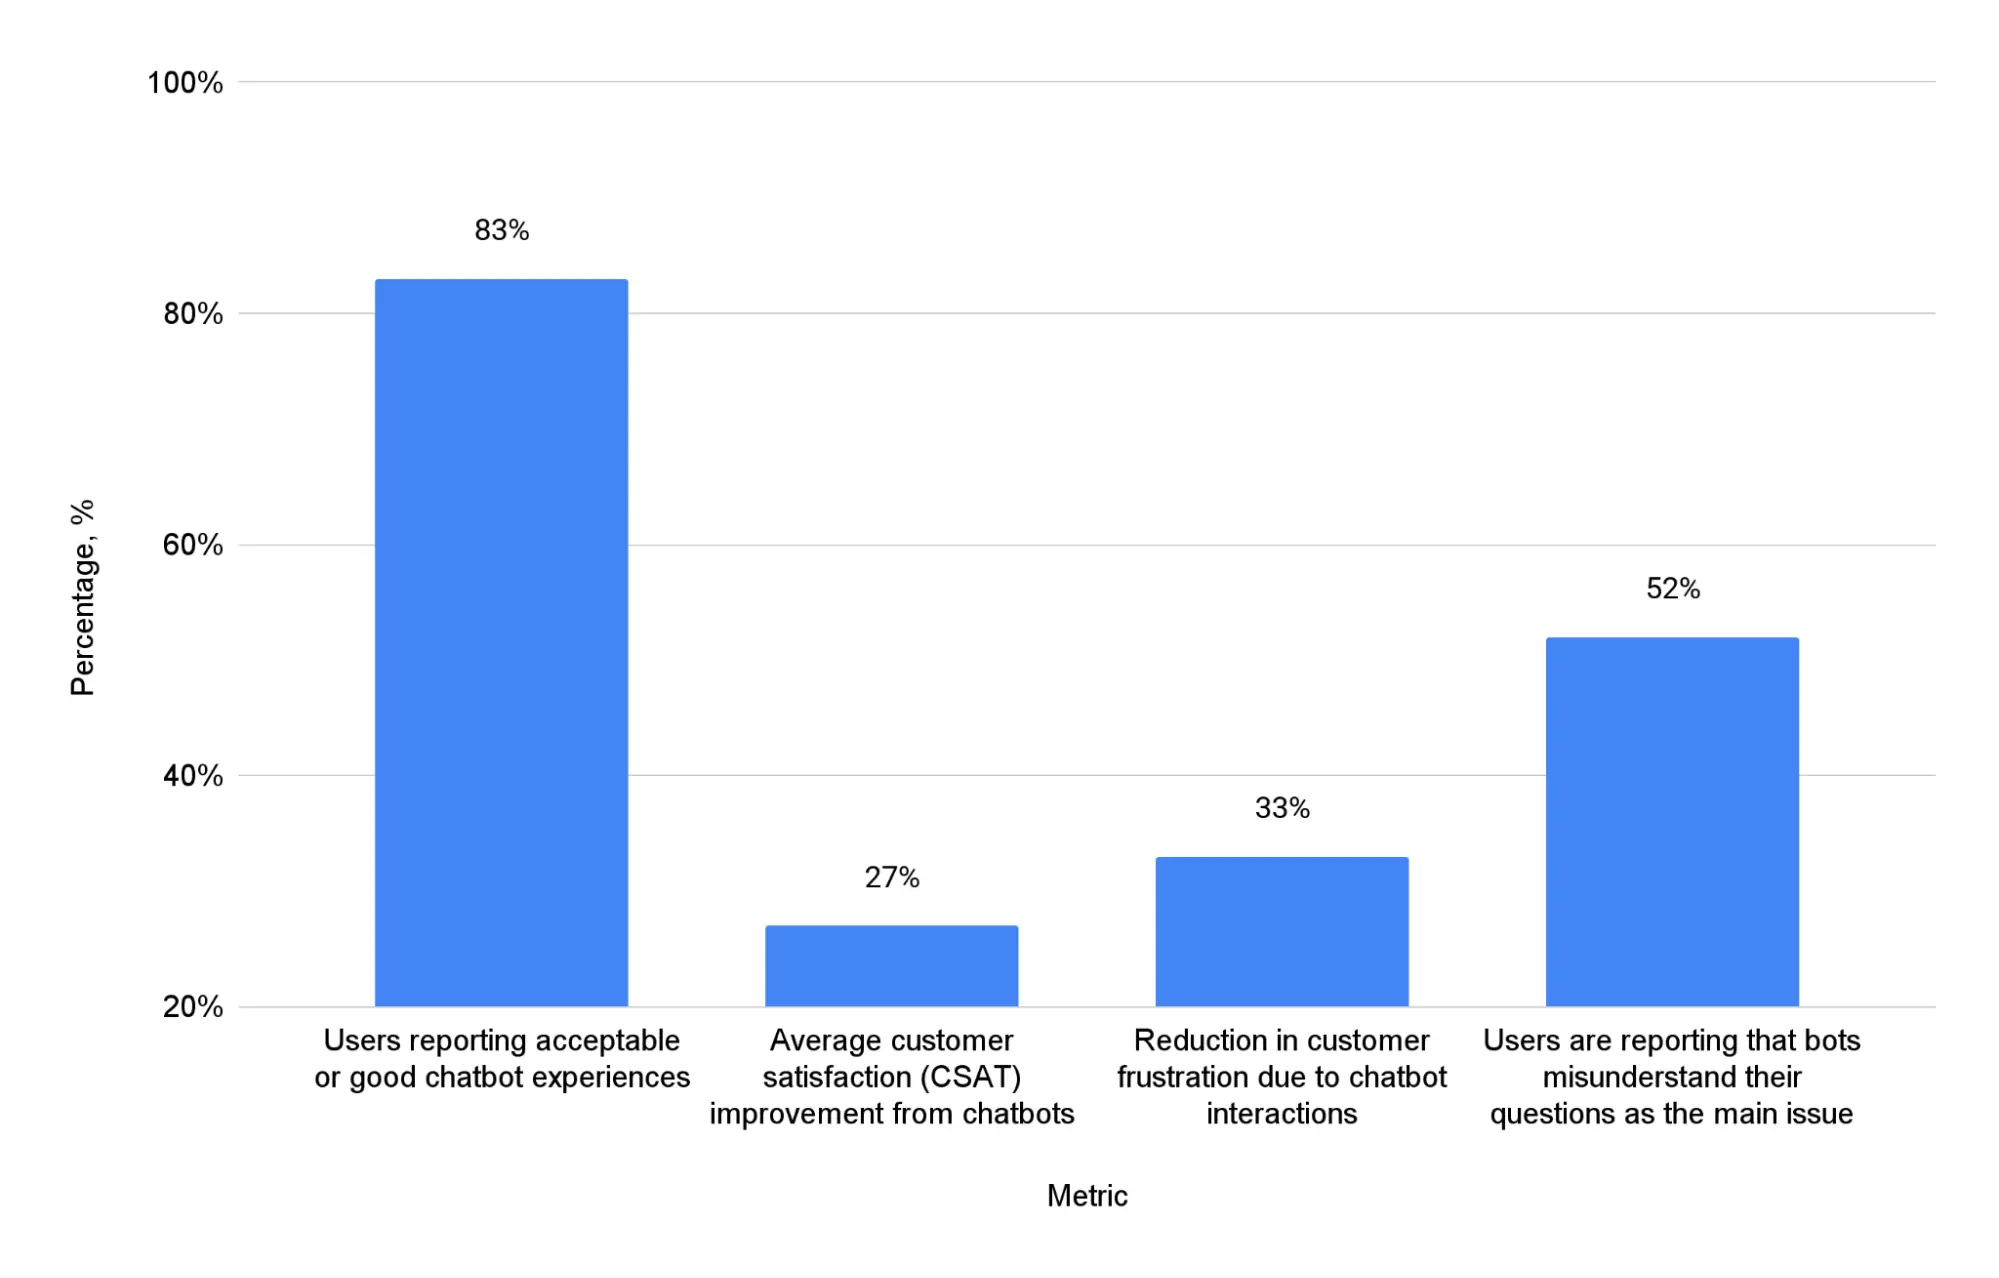
- 83% of users report acceptable or good chatbot experiences, indicating a strong baseline for continued chatbot adoption.
- Chatbots deliver a measurable experience uplift, with average customer satisfaction (CSAT) improving by 27% and customer frustration dropping by 33%.
- Despite positive outcomes, 52% of users report that bots’ misunderstanding of their questions remains the main issue, highlighting a key limitation in current chatbot performance.
Chatbot experience quality: Satisfaction, friction, and user feedback
These chatbot usage statistics suggest that overall experience quality is a net positive driver of adoption, particularly through improved satisfaction and reduced friction. At the same time, the high rate of misunderstanding points to a measurable gap between basic conversational performance and user expectations. For platforms aiming to scale usage and retention, improving language understanding will be critical to strengthening chatbot adoption statistics and expanding who uses chatbots beyond simple use cases.
While experience quality explains how users perceive chatbot interactions, adoption data shows what percentage of businesses use chatbots across different company types.
Chatbot adoption rate by business type
The chart below presents the chatbot adoption rate by business type, comparing how widely chatbots are used across large businesses, global enterprises, B2B companies, and B2C brands. This breakdown helps answer what percentage of companies use chatbots and highlights adoption gaps between different segments.
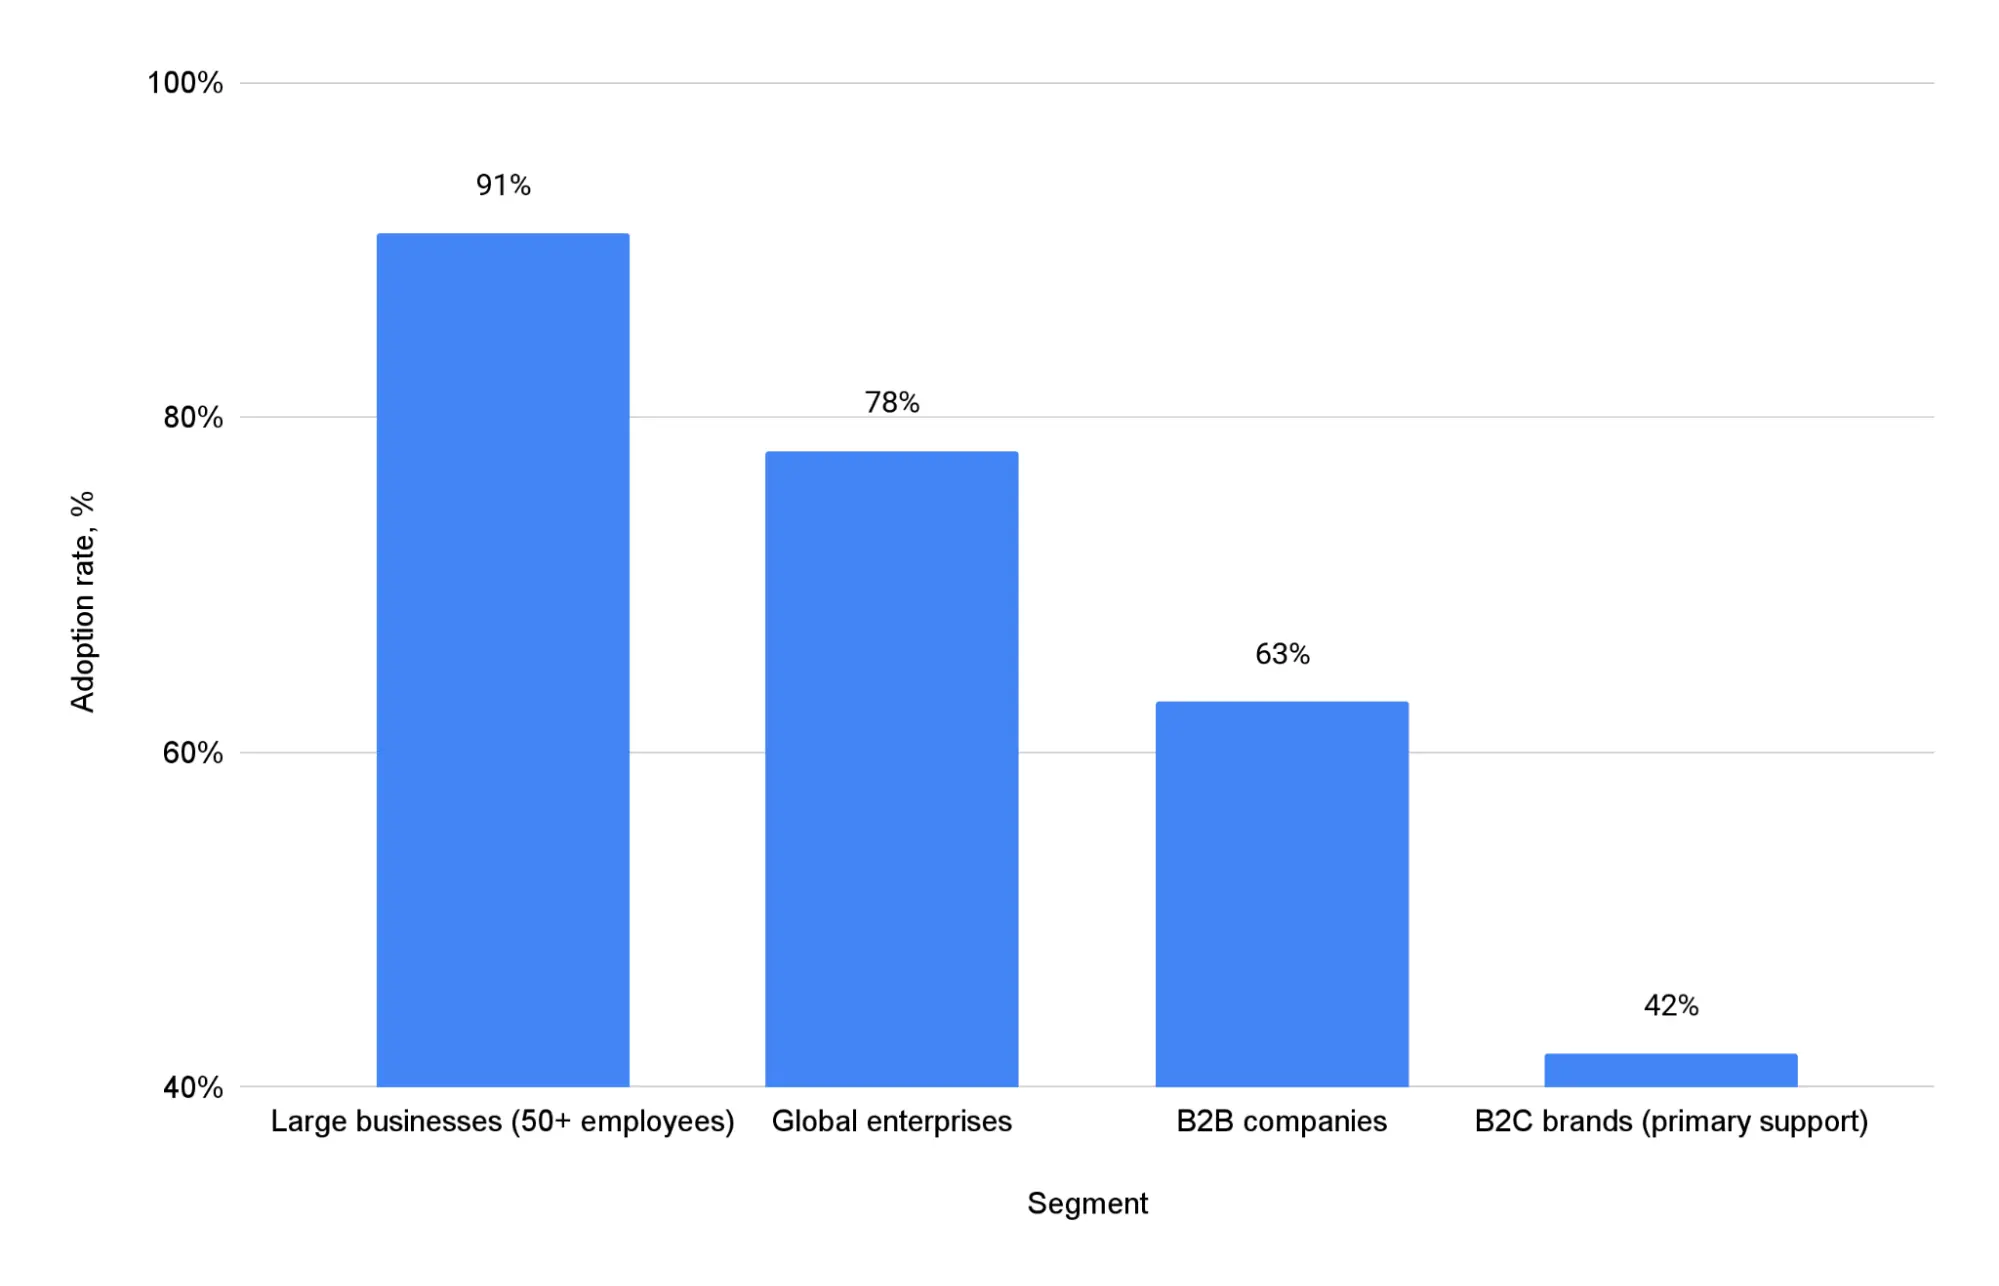
- Large businesses (50+ employees) show the highest chatbot adoption rate at 91%, indicating near-universal usage among larger organizations.
- 78% of global enterprises use chatbots, confirming strong enterprise-level adoption beyond pilot or experimental deployments.
- Adoption is lower among customer-facing segments, with 63% of B2B companies and 42% of B2C brands using chatbots as part of primary support.
Business adoption rate of chatbots across company segments
These figures clarify how many companies use chatbots across different business segments, revealing a clear size- and complexity-driven adoption pattern. The business adoption rate of chatbots increases sharply with organizational scale, suggesting that resources, infrastructure, and automation readiness play a major role. Overall, the data shows that while chatbots are already standard among large enterprises, significant adoption headroom remains among smaller and B2C-focused companies.
After examining what percentage of companies use chatbots, the next step is to assess how chatbot adoption translates into measurable performance gains in customer support operations.
Chatbot response time and handling efficiency in customer support
The chart below focuses on chatbot response time & handling efficiency, highlighting how automation affects speed, queue management, and workload distribution in customer service. These metrics add context to broader AI in customer service statistics by quantifying the operational impact of chatbots beyond adoption alone.
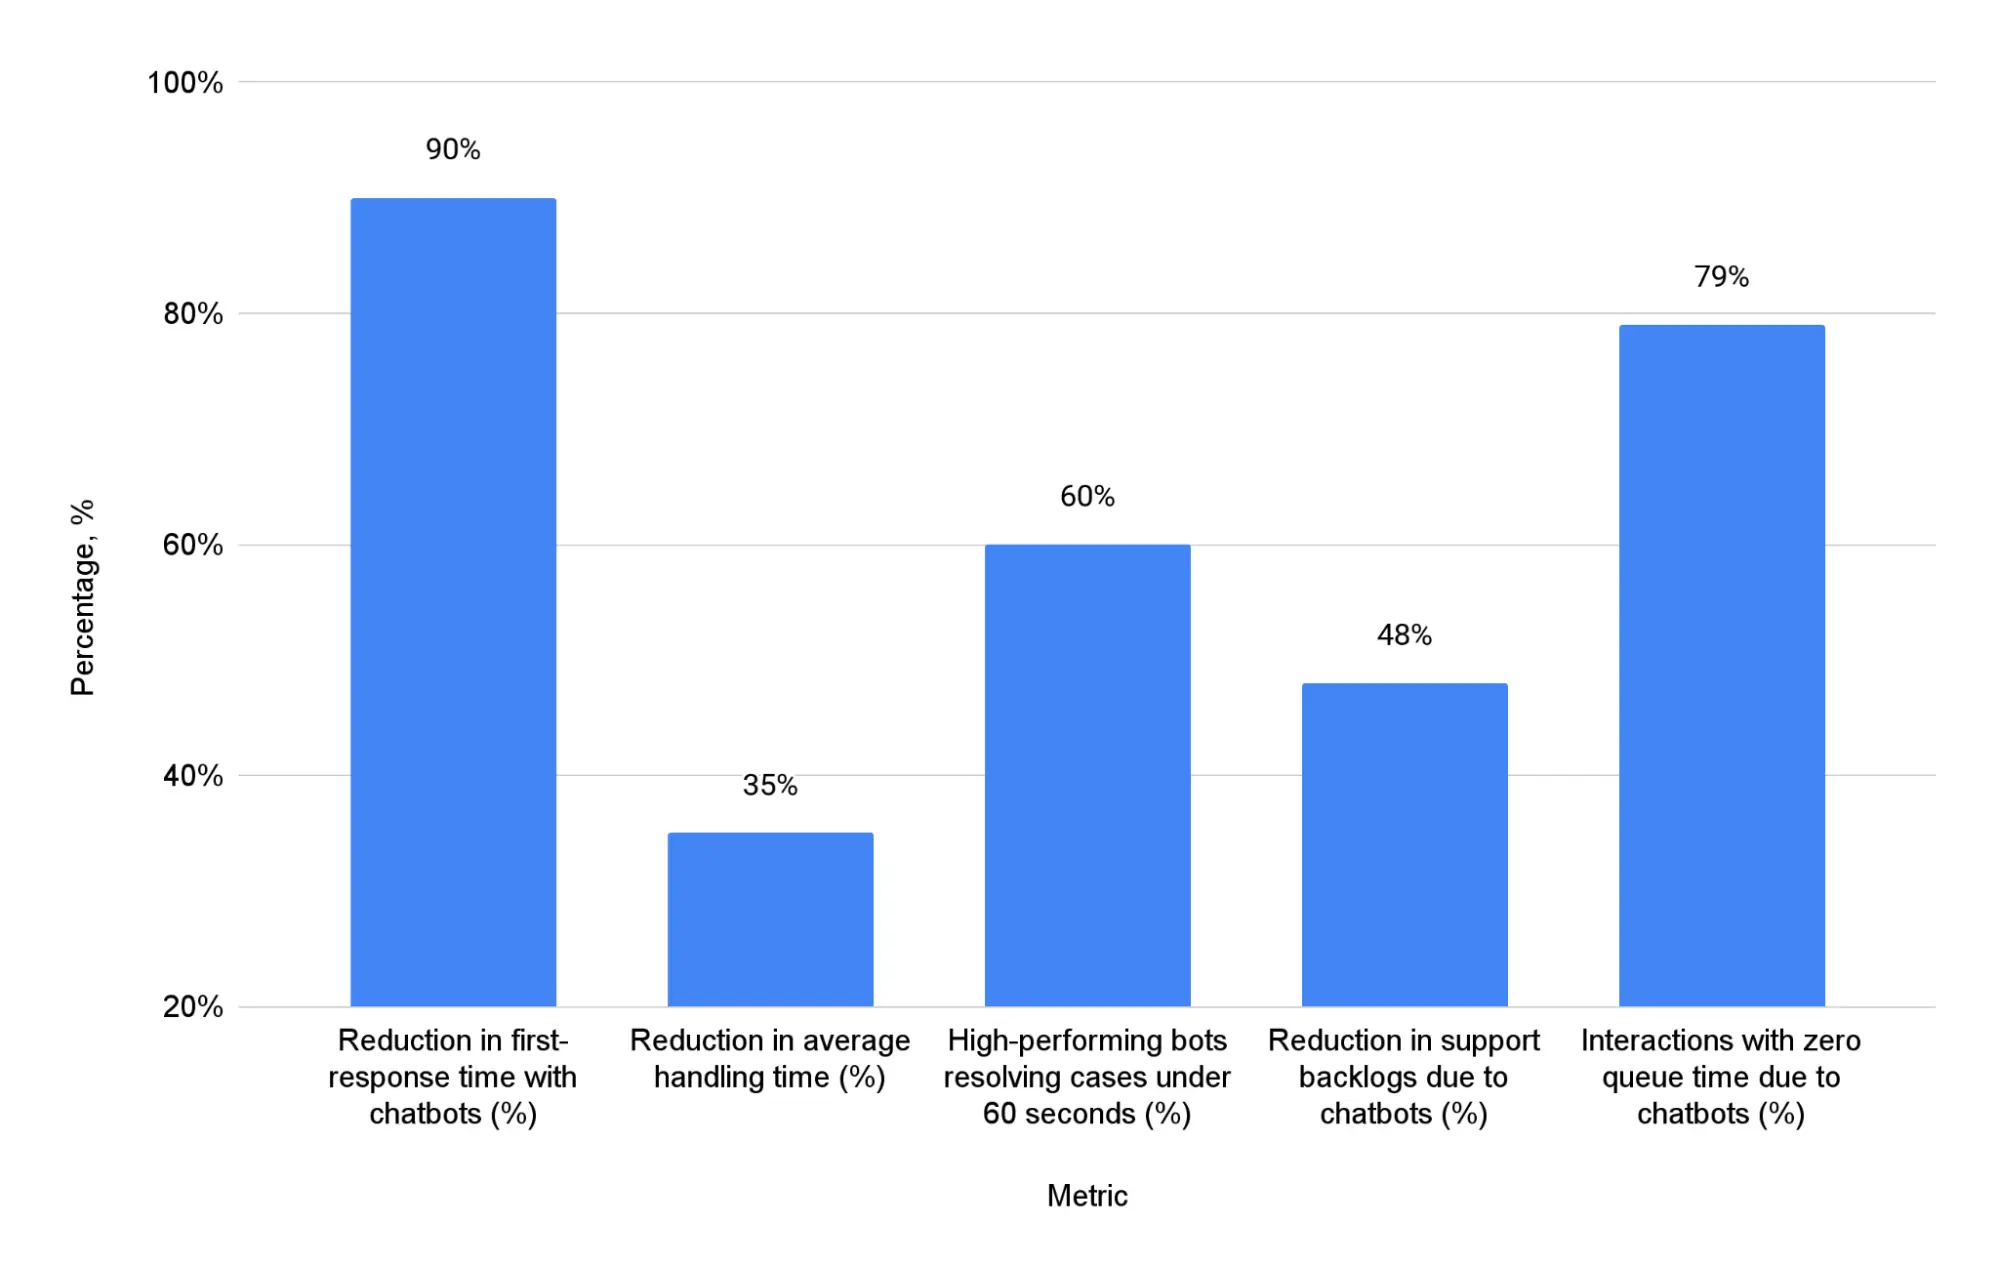
- Chatbots deliver immediate efficiency gains, with a 90% reduction in first-response time and 79% of interactions experiencing zero queue time.
- Operational workload is significantly reduced, as average handling time drops by 35% and support backlogs decline by 48% after chatbot deployment.
- Performance quality remains high, with 60% of high-performing bots resolving cases in under 60 seconds, reinforcing the chatbot customer support cost reduction percentage seen in automated environments.
How chatbots improve response time and support efficiency
These results demonstrate the tangible chatbot automation impact on support costs, driven primarily by faster responses and lower handling overhead. Improvements in speed and backlog reduction directly support average customer support cost savings from chatbots, even without increasing headcount. When combined with broader adoption trends and chatbot marketing initiatives that drive higher interaction volumes, efficiency gains like these help explain why businesses continue to invest in automated customer service, regardless of how much a customer service chatbot costs upfront.
While response time improvements show how quickly chatbots handle customer requests, automation metrics explain how much human workload is actually removed from support teams.
Chatbot automation and human workload reduction in customer support
The chart below examines chatbot automation & human workload reduction, focusing on how effectively chatbots deflect tickets, reduce escalation, and improve agent productivity. These indicators complement broader AI in customer service statistics by showing how automation reshapes day-to-day support operations.
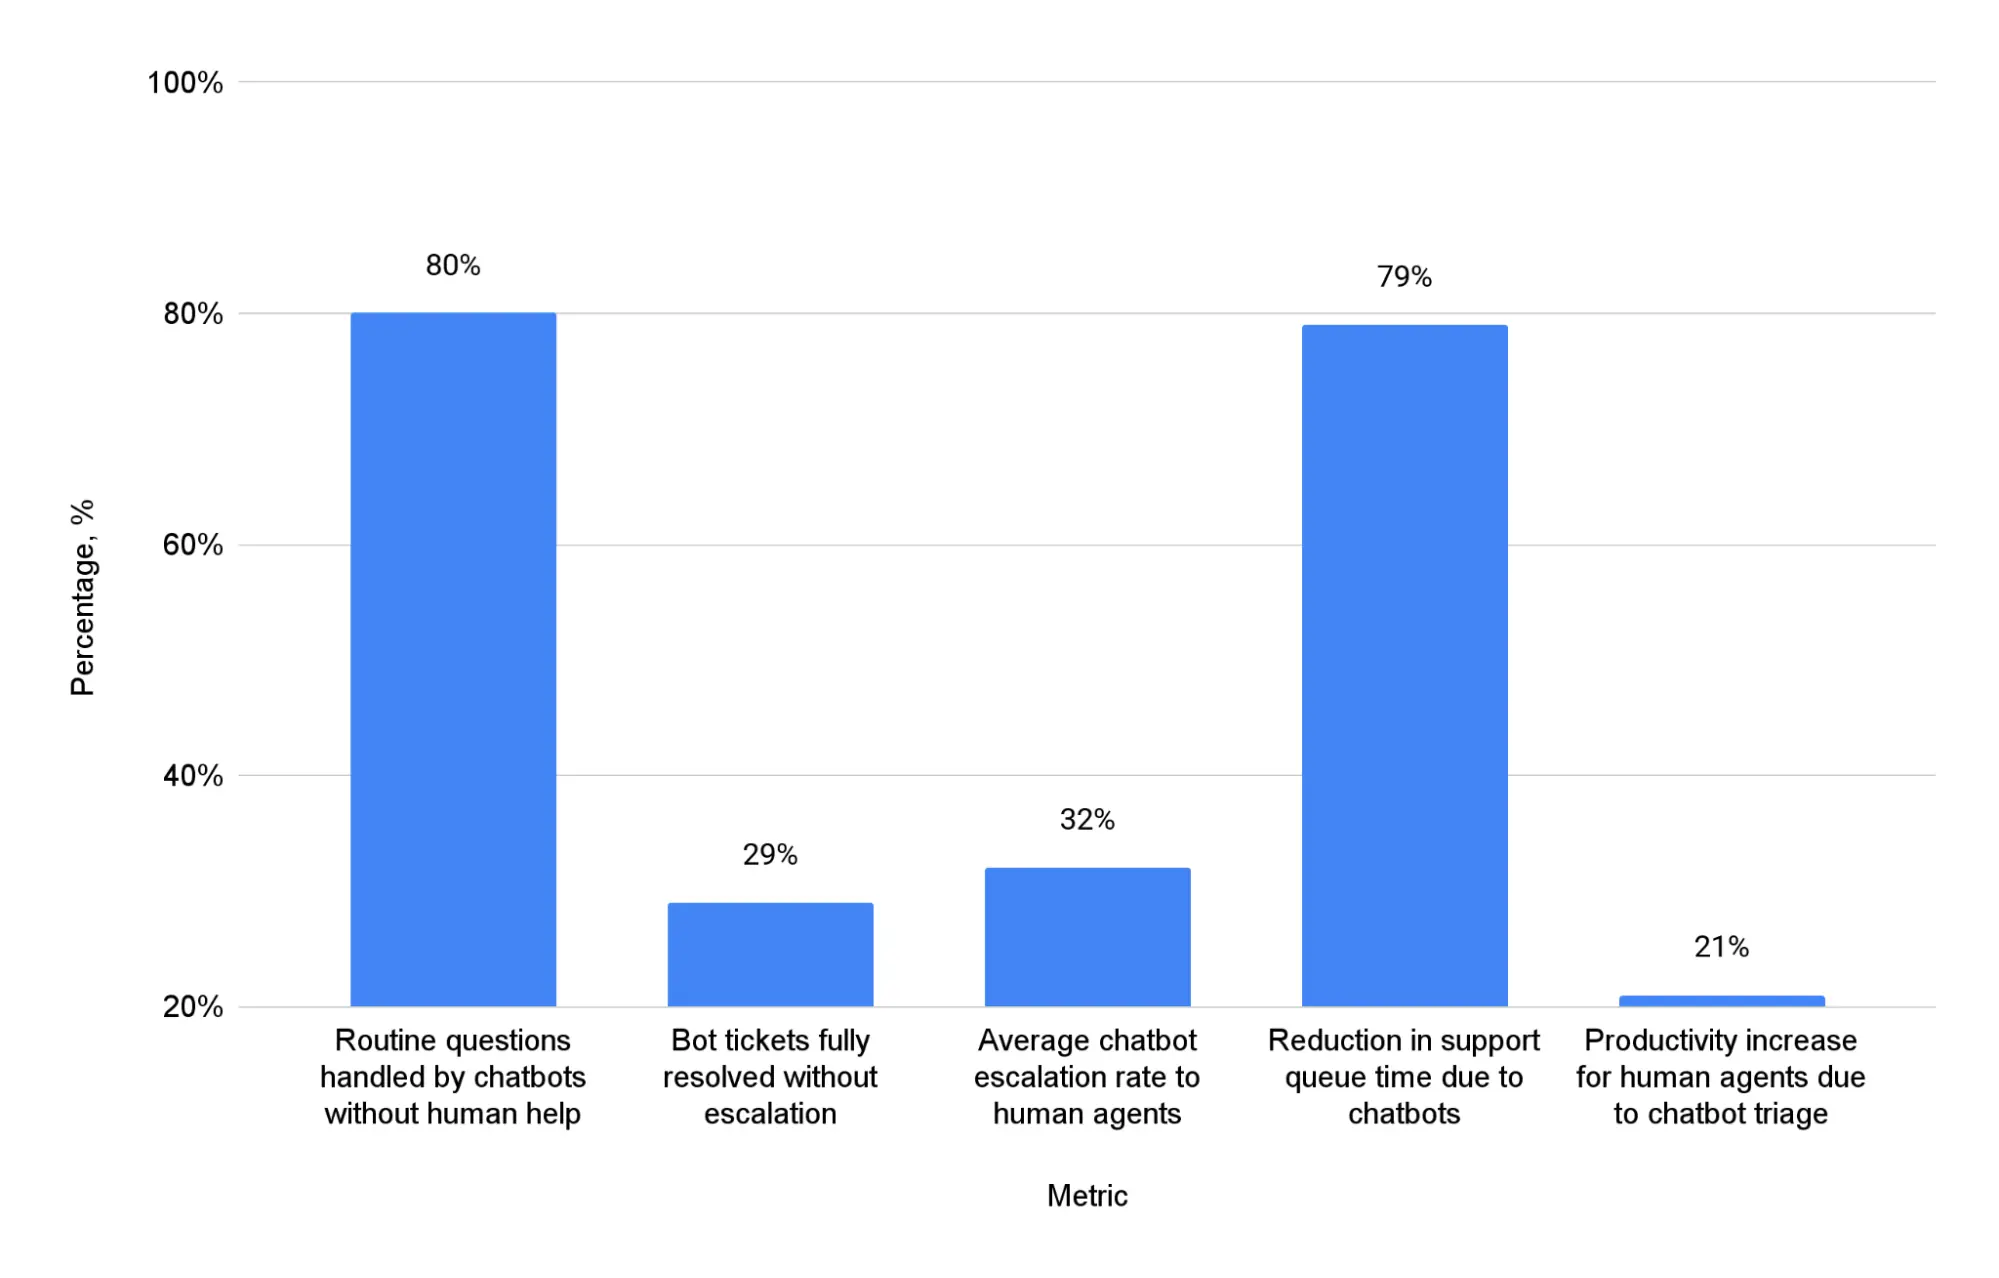
- Chatbots handle a substantial share of support volume independently, with 80% of routine questions resolved without human help and 29% of bot tickets fully resolved without escalation.
- Human involvement is significantly reduced, as the average chatbot escalation rate to human agents is 32% while support queue time drops by 79%.
- Automation delivers measurable productivity gains, with a 21% increase in human agent productivity driven by chatbot-led triage.
How chatbot automation reduces human workload in customer service
These results highlight the direct chatbot automation impact on support costs, achieved by shifting routine and repetitive tasks away from human agents. Lower escalation rates and shorter queues help explain average customer support cost savings from chatbots, even before factoring in staffing reductions. From a strategic perspective, automation at this level allows companies to scale customer service efficiently, reinforcing why businesses continue to invest in chatbots regardless of how much a customer service chatbot costs upfront.
While automation metrics show how chatbots reduce human workload and support costs, the next step is to examine whether these efficiency gains translate into measurable commercial outcomes.
Cost, productivity, and revenue-adjacent efficiency gains from chatbots
The chart below focuses on cost, productivity & revenue-adjacent efficiency gains, highlighting how chatbot-driven automation influences sales performance, conversion efficiency, and purchase behavior. These results help address the question of whether chatbots increase sales by linking operational improvements to downstream revenue indicators.
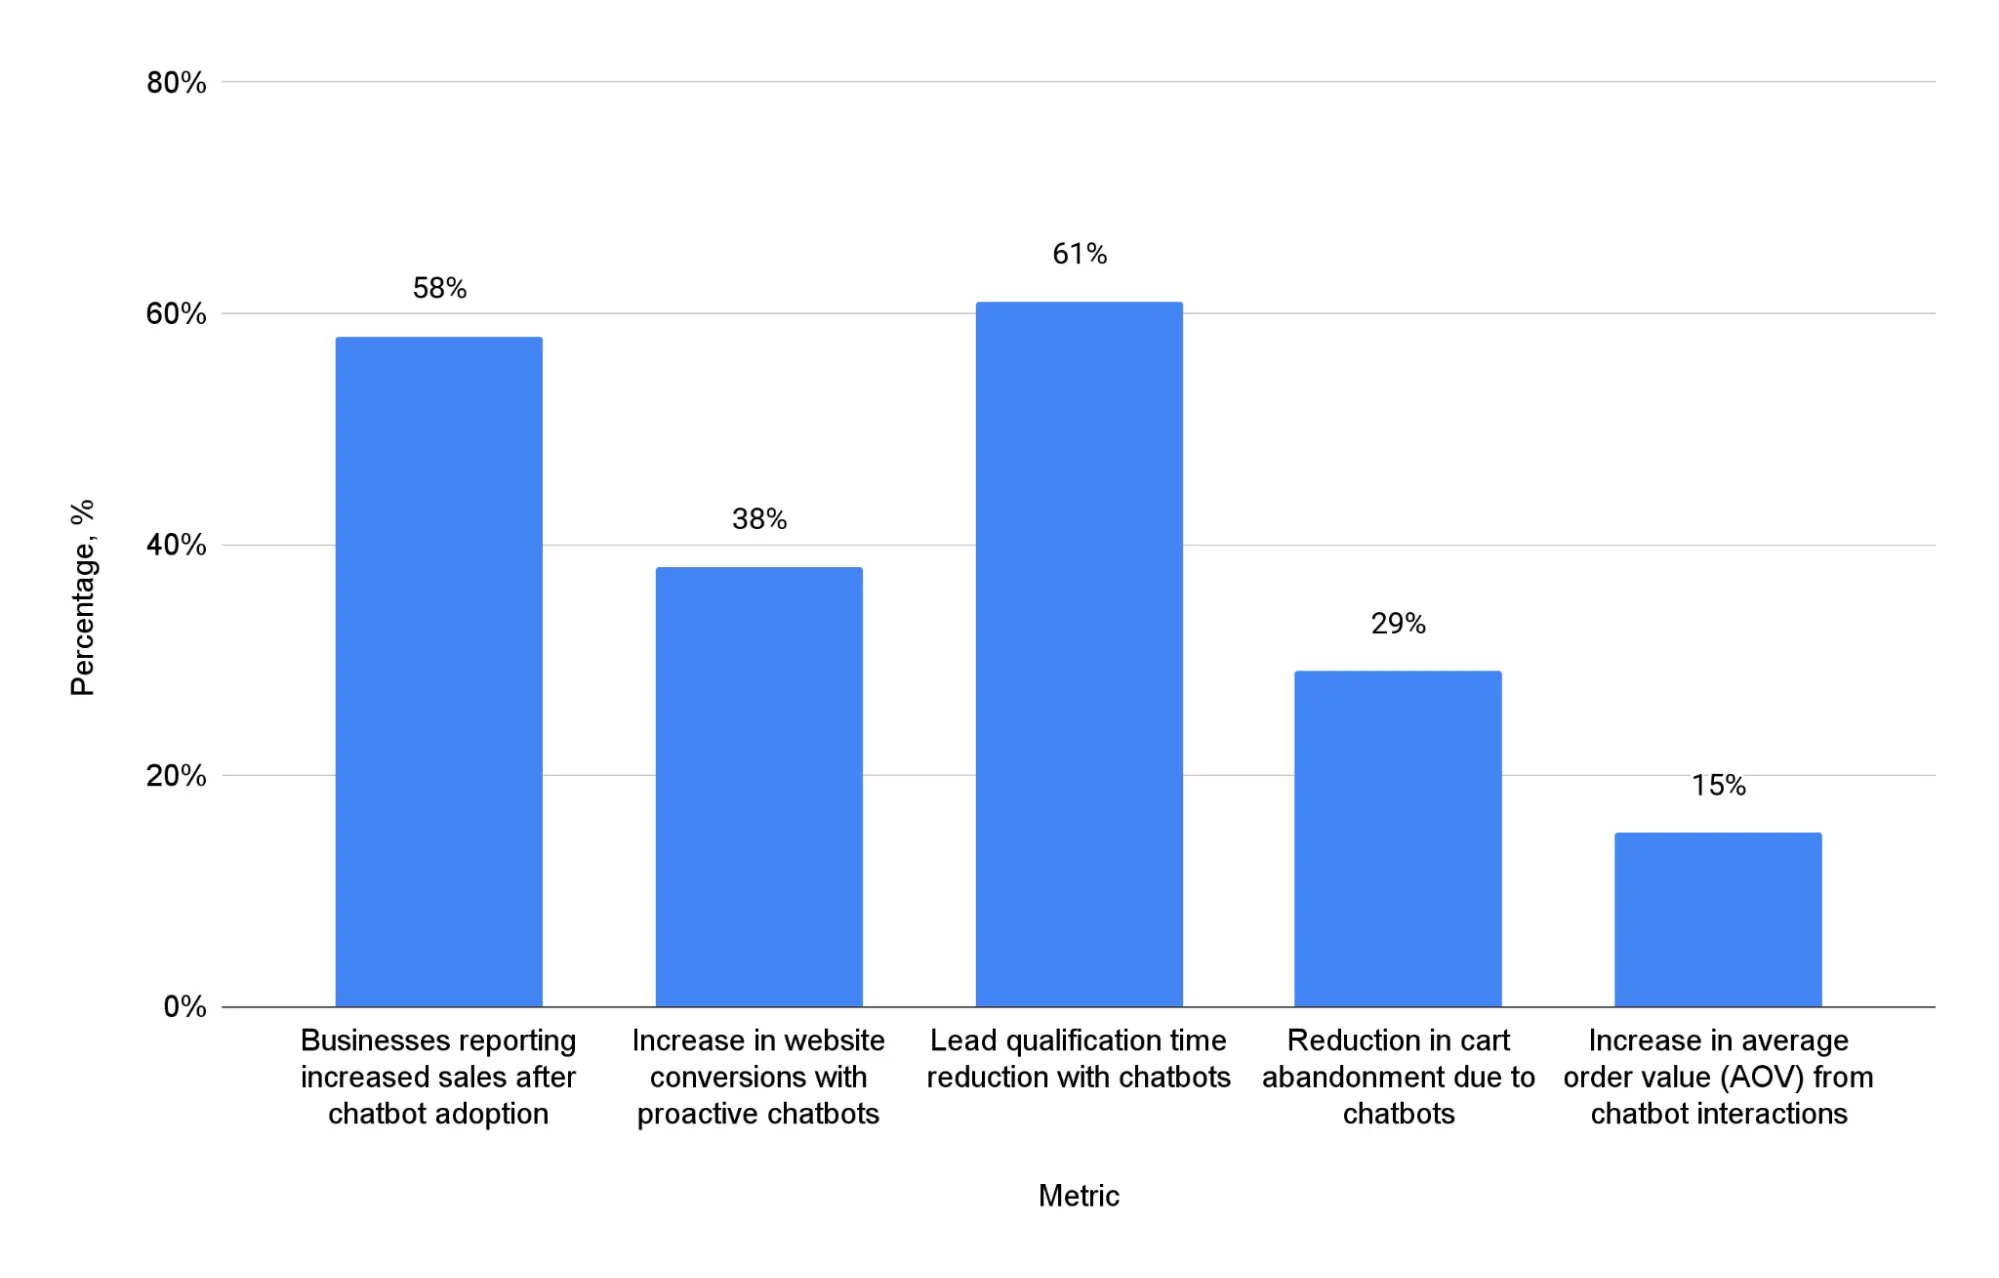
- A clear majority of companies see commercial benefits, with 58% of businesses reporting increased sales after chatbot adoption.
- Funnel efficiency improves significantly, as website conversions rise by 38% and lead qualification time drops by 61% when chatbots are integrated.
- Chatbots positively influence purchase behavior, reducing cart abandonment by 29% and increasing average order value (AOV) by 15%.
How chatbots increase sales through operational efficiency
These figures show that chatbots deliver value beyond cost reduction by supporting revenue growth through faster, more efficient customer journeys. Overall, the results suggest that even without a standalone chatbot-driven sales growth rate, operational efficiency gains consistently translate into stronger commercial performance.
While efficiency and revenue-adjacent gains show how chatbots improve performance, cost reduction metrics reveal the direct financial impact of chatbot adoption on customer support operations.
Customer support cost reductions from chatbot adoption
The chart below focuses on customer support cost reductions, illustrating how chatbots lower operational expenses across staffing, ticket volume, and labor hours. It highlights both immediate cost deflection and structural efficiency gains achieved through automation.
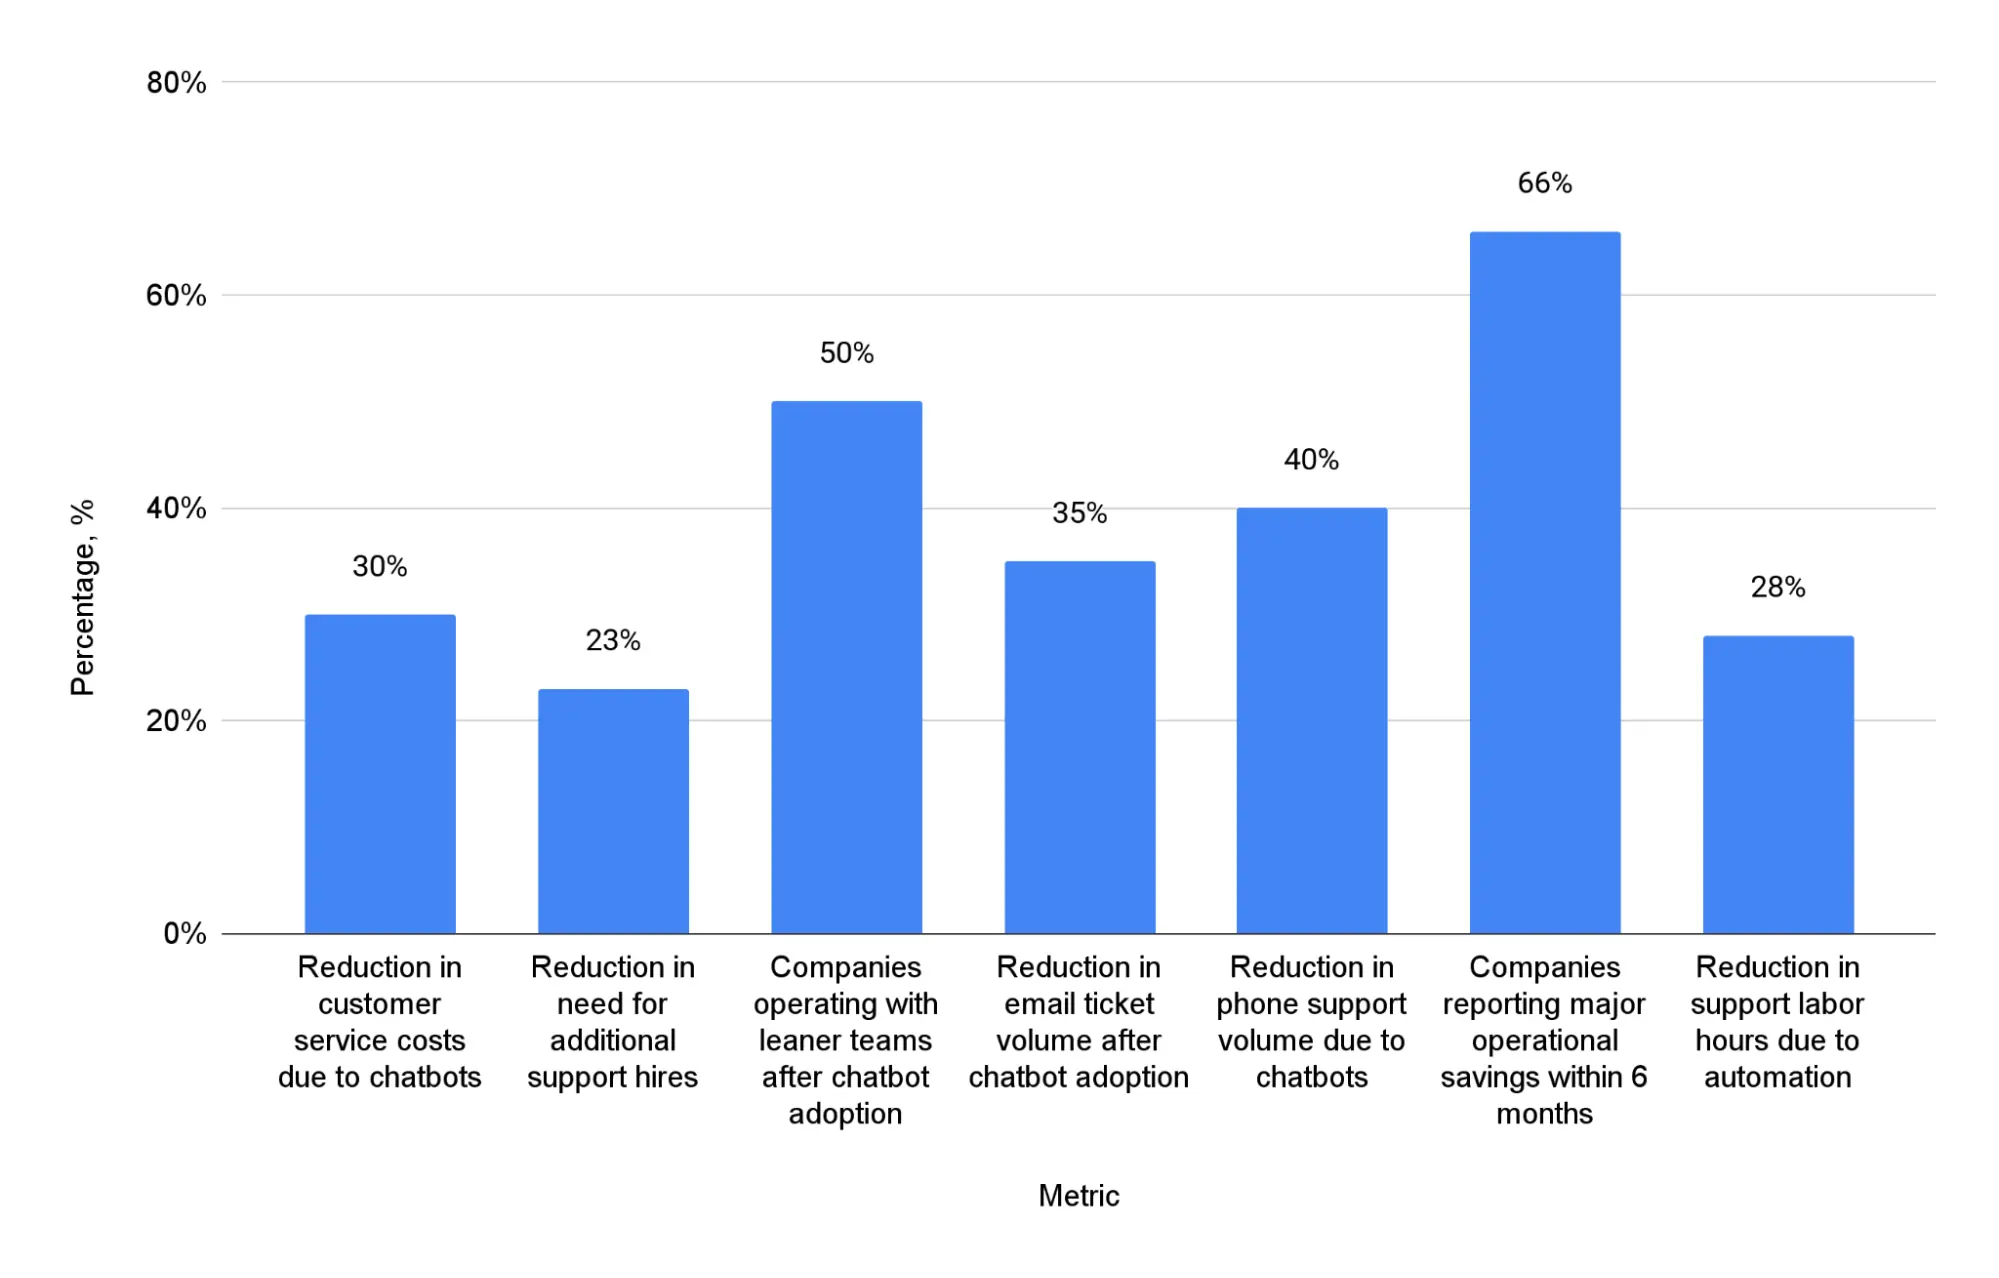
- Chatbots drive substantial cost efficiency, with customer service costs reduced by 30% and support labor hours cut by 28%.
- Staffing pressure is significantly lower, as 23% fewer additional hires are needed, and 50% of companies report operating with leaner teams after adoption.
- Volume-based savings are widespread, with email ticket volume reduced by 35%, phone support volume by 40%, and 66% of companies seeing major operational savings within six months.
How chatbots reduce customer support costs
These results demonstrate that chatbot adoption delivers measurable and multi-layered cost reductions across customer support functions. Savings are driven not only by automation of interactions, but also by long-term workforce optimization and lower inbound support volumes. Taken together, the data show that chatbots function as a structural cost-control mechanism rather than a short-term efficiency tweak, making them a core component of modern support operations.
Conclusions
- The data shows that chatbots are no longer a peripheral technology but a structural component of the modern digital economy. The steady expansion of the global chatbot market from $1.42 billion in 2025 to $7.96 billion by 2035, combined with a sustained growth rate near 19% for most of the period, indicates long-term adoption rather than cyclical experimentation. This trajectory suggests that chatbots are moving into a mature phase where scale, integration, and efficiency matter more than novelty.
- Market dynamics reveal a clear concentration of usage and influence. With ChatGPT holding over 81% of the AI chatbot market share worldwide, the competitive landscape is shaped by the presence of network effects and highly concentrated market dynamics. While smaller platforms continue to innovate in niche areas, the dominance of a single player highlights how data scale, ecosystem integration, and brand trust increasingly determine success in conversational AI markets.
- On the user side, adoption is driven by practicality rather than curiosity. High expectations for instant messaging, strong preference for chatbots over waiting for human agents, and generally positive experience ratings indicate that conversational interfaces are becoming a baseline digital expectation. At the same time, persistent issues such as misunderstanding user intent show that experience quality remains a key constraint on deeper and more complex use cases.
- For businesses, chatbot adoption follows a clear structural pattern. Large enterprises and complex organizations lead adoption, while smaller and B2C-focused companies lag, leaving substantial headroom for future growth. Where chatbots are deployed, the impact is measurable: faster response times, lower handling volumes, reduced staffing pressure, and significant cost reductions across support operations. These gains position chatbots as a core efficiency lever rather than a simple customer-facing tool.
- Crucially, the impact extends beyond cost control into revenue-adjacent outcomes. Improved conversion rates, higher average order value, reduced cart abandonment, and widespread reports of increased sales show that operational efficiency can translate directly into commercial performance. Taken together, the evidence suggests that chatbots are reshaping how organizations scale customer interaction, blending automation, productivity, and revenue optimization. As adoption continues, competitive advantage will increasingly depend not on whether companies use chatbots, but on how effectively they integrate them into end-to-end customer journeys.
Sources
- “AI Chatbot Market Share Worldwide | Statcounter Global Stats.” StatCounter Global Stats, 1 Jan. 2009, https://gs.statcounter.com/ai-chatbot-market-share/all/worldwide/2025. Accessed 18 February 2026.
- Nash, Bill. “Chatbot Statistics 2025: 99+ Stats & Insights [Expert Analysis] – Marketing LTB.” Marketing LTB -, 14 Nov. 2025, https://marketingltb.com/blog/statistics/chatbot-statistics/. Accessed 18 February 2026.
- Zoting, Learn. Chatbot Market Size To Hit Around USD 7.96 Billion By 2035. https://www.precedenceresearch.com/chatbot-market. Accessed 18 February 2026.


 Built-in AI detector