 Article fact-checked
-
AI diffusion is highly uneven globally in H2 2025, led by the UAE (64.0%) and Singapore (60.9%), while the US sits at 28.3%.
-
Day-to-day AI use is already mainstream among surveyed workers: 86.7% of workers use AI for daily tasks, vs 13.3% who do not.
-
Usage intensity is high, with 84.7% using AI at least weekly (46.2% a few times a week + 38.5% every day).
-
Workers see a major readiness gap: only 13% received AI training in the past year, while 55% want more AI training and 53% expect AI to impact their role.
-
Trust remains low, with 67.7% saying they do not trust AI companies (vs 32.3% who do).
-
ChatGPT dominates employee tool choice at 76.3%, far ahead of Bard (7.5%) and other tools (16.2%).
-
AI delivers measurable outcomes: 51.6% report significant work-quality improvements, and daily AI users are far more likely to save 4+ hours per week (33.5%) than 1-day users (11.5%).
Workplace AI adoption is accelerating, but confidence isn’t keeping up. While employees increasingly use AI tools for daily tasks, many still question whether AI companies can be trusted, and a meaningful share worry about long-term job security. Using the newest AI in the workplace statistics, this article maps the gap between usage and sentiment, explains how workers use AI at work across roles, and quantifies the real AI productivity gains workers report from using AI week after week.
Top countries by AI diffusion in the workplace (H2 2025)
This chart shows AI diffusion by country in H2 2025, highlighting where workplace AI usage is most widespread. It provides a clear benchmark for comparing the percentage of workers using AI at work by country across the top-performing markets. These differences help contextualize what “mainstream AI adoption” looks like in practice across regions. AI diffusion is used here as a country-level indicator of workplace AI penetration.

- The United Arab Emirates leads the ranking with 64.0% AI diffusion, ahead of Singapore at 60.9%.
- Within the top 10, the lowest-ranked country is Qatar at 38.3%, meaning the top-to-bottom spread across the top 10 is 25.7 percentage points (64.0% vs 38.3%).
- The United Kingdom and the Netherlands are tied at 38.9%, placing them just above New Zealand at 40.5% and below Spain at 41.8%.
AI diffusion by country in H2 2025
Overall, these AI in the workplace statistics show that AI adoption is already highly concentrated in a small group of countries, with the leaders crossing the 60% mark. At the same time, several major economies sit closer to the high-20% range (for example, the United States at 28.3%), reinforcing that the percentage of workers using AI at work varies sharply by geography.
After comparing AI in the workplace statistics across countries, the next step is to quantify overall adoption by looking at how many workers actually use AI in their daily work.
Share of workers using AI in the workplace
This chart shows the share of workers who report using AI tools for work-related tasks, focusing specifically on day-to-day usage. It provides a direct snapshot of the percentage of workers using AI at work today. In other words, it answers a core adoption question: how common AI has become in everyday workflows.

- 86.7% of respondents say they are using AI for day-to-day tasks, indicating widespread workplace adoption.
- Only 13.3% report not using AI for day-to-day tasks, making non-adoption a clear minority position.
- The gap between AI users and non-users is 73.4 percentage points (86.7% vs 13.3%), showing a strong skew toward routine AI usage.
Percentage of workers using AI at work for day-to-day tasks
These AI in the workplace statistics suggest that AI is no longer experimental for most employees; it is already embedded in daily work routines. With nearly nine in ten workers reporting regular use, the percentage of workers using AI at work reflects a mature adoption phase rather than early-stage testing.
While overall adoption is already high, the next question is whether AI usage is evenly distributed or concentrated among specific experience groups.
AI usage by employees’ experience level
This chart breaks down AI adoption by years of experience, showing how workplace AI usage varies across career stages. It adds more depth to AI in the workplace statistics by revealing which employee segments are most represented among AI users. This experience-based view helps explain how adoption may differ between early-career and senior professionals

- The largest share of AI-using respondents comes from employees with 6-10 years of experience at 26.2%.
- Employees with 10-15 years of experience account for 20.0%, compared with 18.5% for those with 1-3 years.
- The smallest segment is 15-20 years of experience at 7.6%, which is 18.6 percentage points lower than the 6-10 year group (26.2% vs 7.6%).
Percentage of workers using AI at work by experience
These AI in the workplace statistics indicate that AI usage is not limited to junior employees; it is strongly represented in mid-career groups as well. The distribution peaks among professionals with 6-10 years of experience, suggesting that workers who are established in their roles may be most actively integrating AI into daily workflows.
Beyond whether employees use AI at all, frequency data shows how deeply AI is embedded into everyday workflows.
How often workers use AI tools at work
This chart measures the density of AI usage at work, showing how often workers rely on AI tools in practice. It adds an important layer to AI in the workplace statistics by separating occasional experimentation from consistent, repeated usage. In short, it helps quantify how “routine” AI has become at work.

- Nearly four in ten respondents use AI every day (38.5%), showing that daily usage is already mainstream.
- The largest group uses AI a few times a week (46.2%), making weekly usage the dominant pattern.
- Only 15.3% use AI infrequently (3.0% rarely + 12.3% a few times a month), meaning 84.7% use AI at least weekly.
AI usage frequency at work: Weekly vs daily adoption
These AI in the workplace statistics suggest that adoption is not just broad, it is also intensive, with the majority of workers using AI at least weekly. The split between weekly (46.2%) and daily (38.5%) users indicates that AI is already a recurring productivity layer for many roles, not an occasional tool. This frequency perspective strengthens the overall narrative behind the percentage of workers using AI at work, showing that usage is often habitual rather than sporadic.
While AI usage is becoming routine, the next layer of the story is how workers perceive its impact and whether they feel supported with training.
How do workers feel about AI? Training demand vs expected impact
This chart summarizes workers’ feelings about AI, focusing on training access, training demand, and expectations of AI-driven change. It complements adoption-focused AI in the workplace statistics by showing whether employees feel prepared for what comes next. In particular, it highlights the gap between formal training availability and the desire for more upskilling.

- Only 13% of workers say they have been offered AI training in the past year, suggesting limited structured support.
- A majority (55%) report they want more AI training, indicating strong unmet demand for upskilling.
- 53% believe AI will impact their industry and role, showing that expectations of change are already widespread.
Workers’ feelings about AI: Upskilling needs and industry impact
Overall, the data shows a gap between training access and training demand: workers largely expect AI to reshape their roles, but relatively few have received formal training. This combination can intensify uncertainty and feed narratives around the fear of AI replacing jobs, even when adoption is framed positively.
Alongside training gaps and expectations of disruption, trust in the companies building AI tools is another key factor shaping worker sentiment.
Do workers trust AI companies?
This chart measures whether workers trust AI companies, offering a simple but high-signal view of confidence in the AI ecosystem. It supports the broader discussion around workplace adoption by showing that usage and trust do not always move together. For journalists, this is a useful indicator of reputational risk and skepticism within the workforce.

- Only 32.3% of workers say they trust AI companies, indicating trust remains limited.
- A clear majority (67.7%) reports not trusting AI companies, making skepticism the dominant sentiment.
- The trust gap is 35.4 percentage points (67.7% “No” vs 32.3% “Yes”), showing distrust outweighs trust by more than two-to-one.
Worker trust in AI companies: A majority still say “No”
These results suggest that even as AI becomes more embedded in day-to-day work, many employees remain cautious about the organizations behind the technology. Low trust can amplify concerns linked to workplace disruption and reinforce topics such as fear of AI replacing jobs.
Trust issues are important, but the more direct question is whether workers personally fear AI will replace them.
How many workers fear AI will replace their jobs?
This chart captures workers’ fear that AI will replace workers, separating those who actively worry from those who do not. It provides a grounded data point for discussions around the fear of AI replacing jobs. It also highlights a meaningful “undecided” segment that hasn’t fully formed an opinion yet.
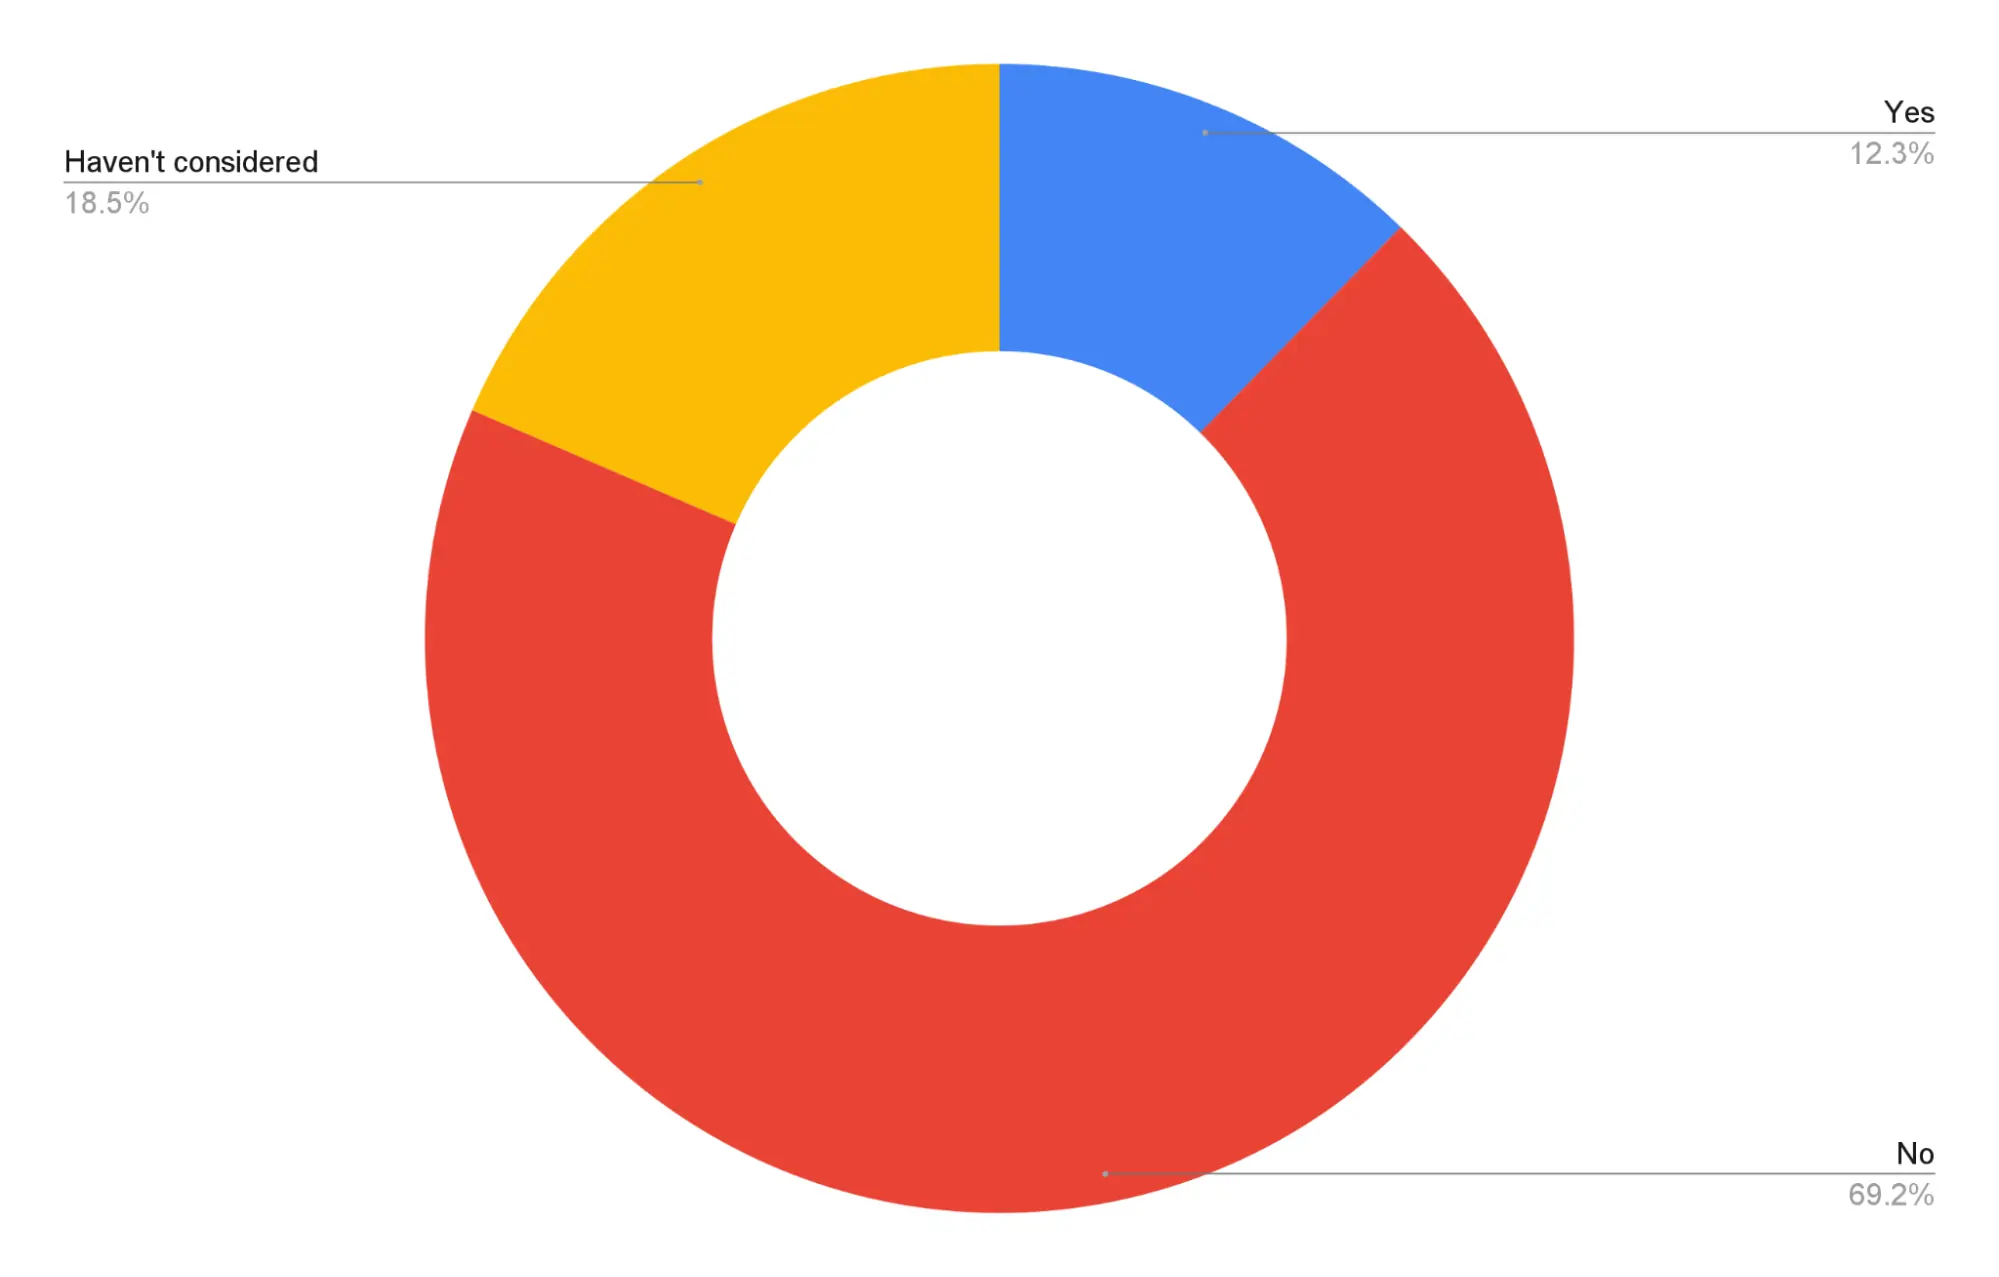
- Only 12.3% of respondents say “Yes”, they fear AI will replace workers.
- A strong majority (69.2%) say “No”, indicating most workers are not currently worried about replacement.
- Nearly one in five (18.5%) haven’t considered the issue, which is 6.2 percentage points higher than the share that explicitly fears replacement (18.5% vs 12.3%).
Fear of AI replacing jobs: How common is it among workers?
These findings suggest that the fear of AI replacing jobs is real, but it is not the dominant view among workers in this dataset. The larger story may be uncertainty: a sizable share has not considered the question, leaving room for sentiment to shift as AI capabilities expand.
After exploring worker sentiment and job-related concerns, the next step is to look at practical adoption, specifically, which tools employees actually rely on.
Which AI tool do employees use most often?
This chart shows which AI tool employees use most often, providing a simple view of real-world tool preference. It supports how workers use AI at work statistics by identifying which platforms dominate day-to-day usage. This kind of breakdown also helps contextualize AI in workplace examples and the most visible benefits of AI in the workplace.

What percentage of workers use ChatGPT?
- ChatGPT is the most-used tool at 76.3%, making it the clear default tool for employees using AI at work.
- Bard accounts for just 7.5%, which is 68.8 percentage points lower than ChatGPT (76.3% vs 7.5%).
- Other tools represent 16.2%, meaning non-ChatGPT options combined still trail ChatGPT by 60.1 percentage points (76.3% vs 16.2%).
Employees using AI at work: The most popular AI tools in 2025
These AI in the workplace statistics show a highly concentrated tool landscape, where one platform captures the vast majority of employee usage. For journalists, this is a key insight: many AI in workplace examples and reported benefits of AI in the workplace are likely being driven by ChatGPT-style workflows rather than a fragmented toolset. Over time, this concentration could influence AI workplace usage trends by year, especially as more vendors compete to become the default assistant for employees using AI at work.
After identifying which tools employees rely on most, it’s equally important to understand what they actually use AI for on the job.
Purposes of AI usage in the workplace
This chart breaks down the most common AI usage purposes in the workplace. It adds context to how workers use AI at work statistics by showing the outcomes employees are trying to achieve, not just whether they use AI. These categories also map directly to the perceived benefits of AI in the workplace and real AI in the workplace examples.
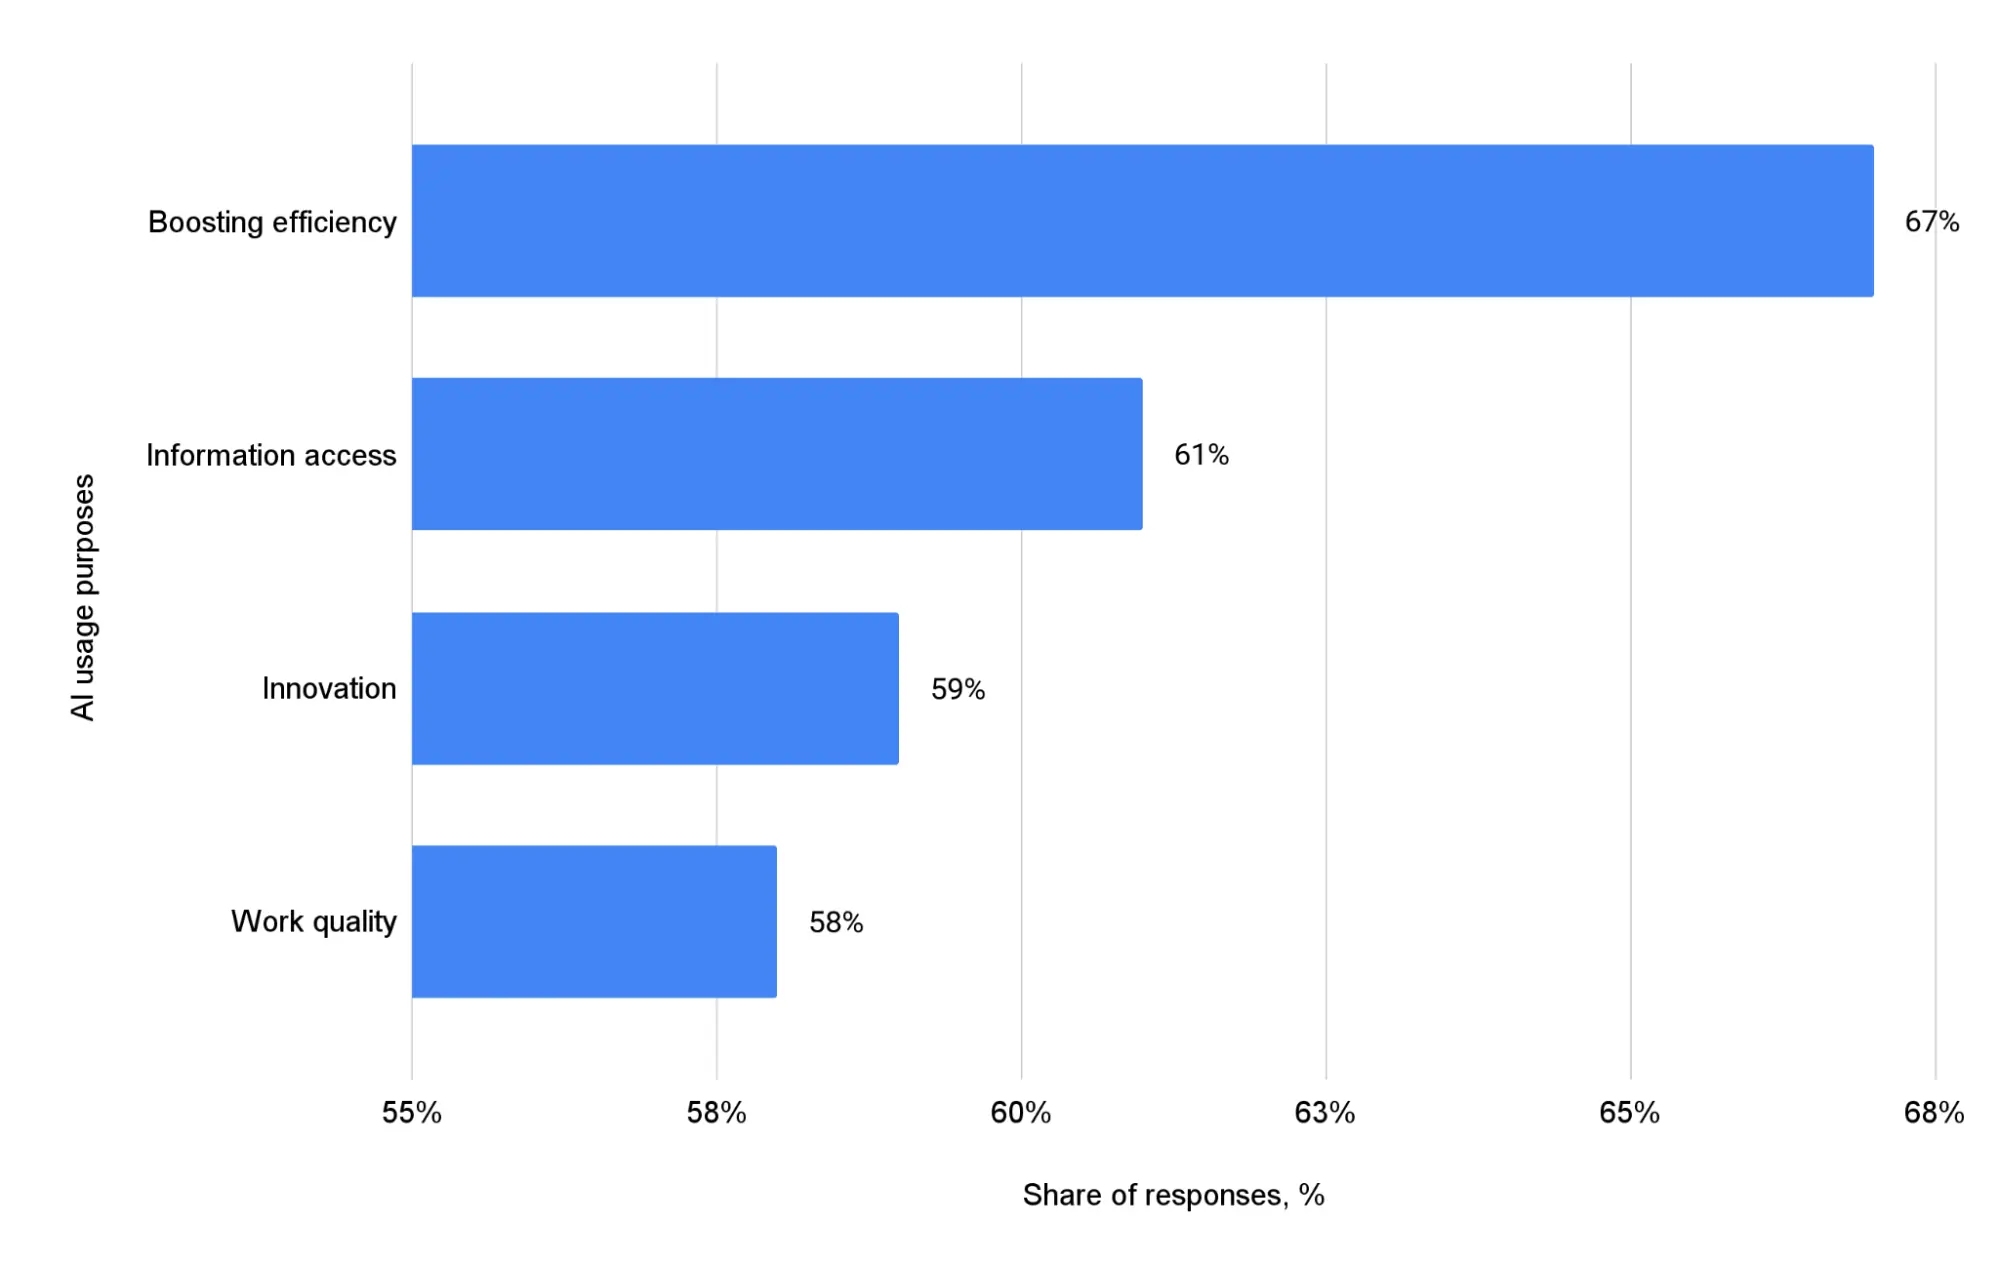
- The top purpose is boosting efficiency at 67%, making productivity the primary driver of adoption.
- Information access ranks second at 61%, just 6 percentage points behind efficiency (67% vs 61%).
- Innovation (59%) and work quality (58%) are nearly tied, separated by only 1 percentage point.
How workers use AI at work: Top reasons and benefits
Overall, these AI in the workplace statistics show that workers are using AI less for novelty and more for measurable improvements in speed, access to knowledge, and output quality. The fact that multiple purposes cluster near the 60% level suggests AI is being adopted as a broad work assistant rather than a single-purpose tool.
Beyond general workplace purposes like efficiency and innovation, marketing teams tend to adopt AI in more specific, execution-focused ways.
Top marketing use-cases for AI tools
This chart highlights the most common AI use cases in marketing, showing where AI tools deliver the most practical value. It expands the discussion of AI in workplace examples by moving from broad motivations to concrete marketing workflows. These results also reinforce the most frequently cited benefits of AI in the workplace, especially around content, planning, and optimization.
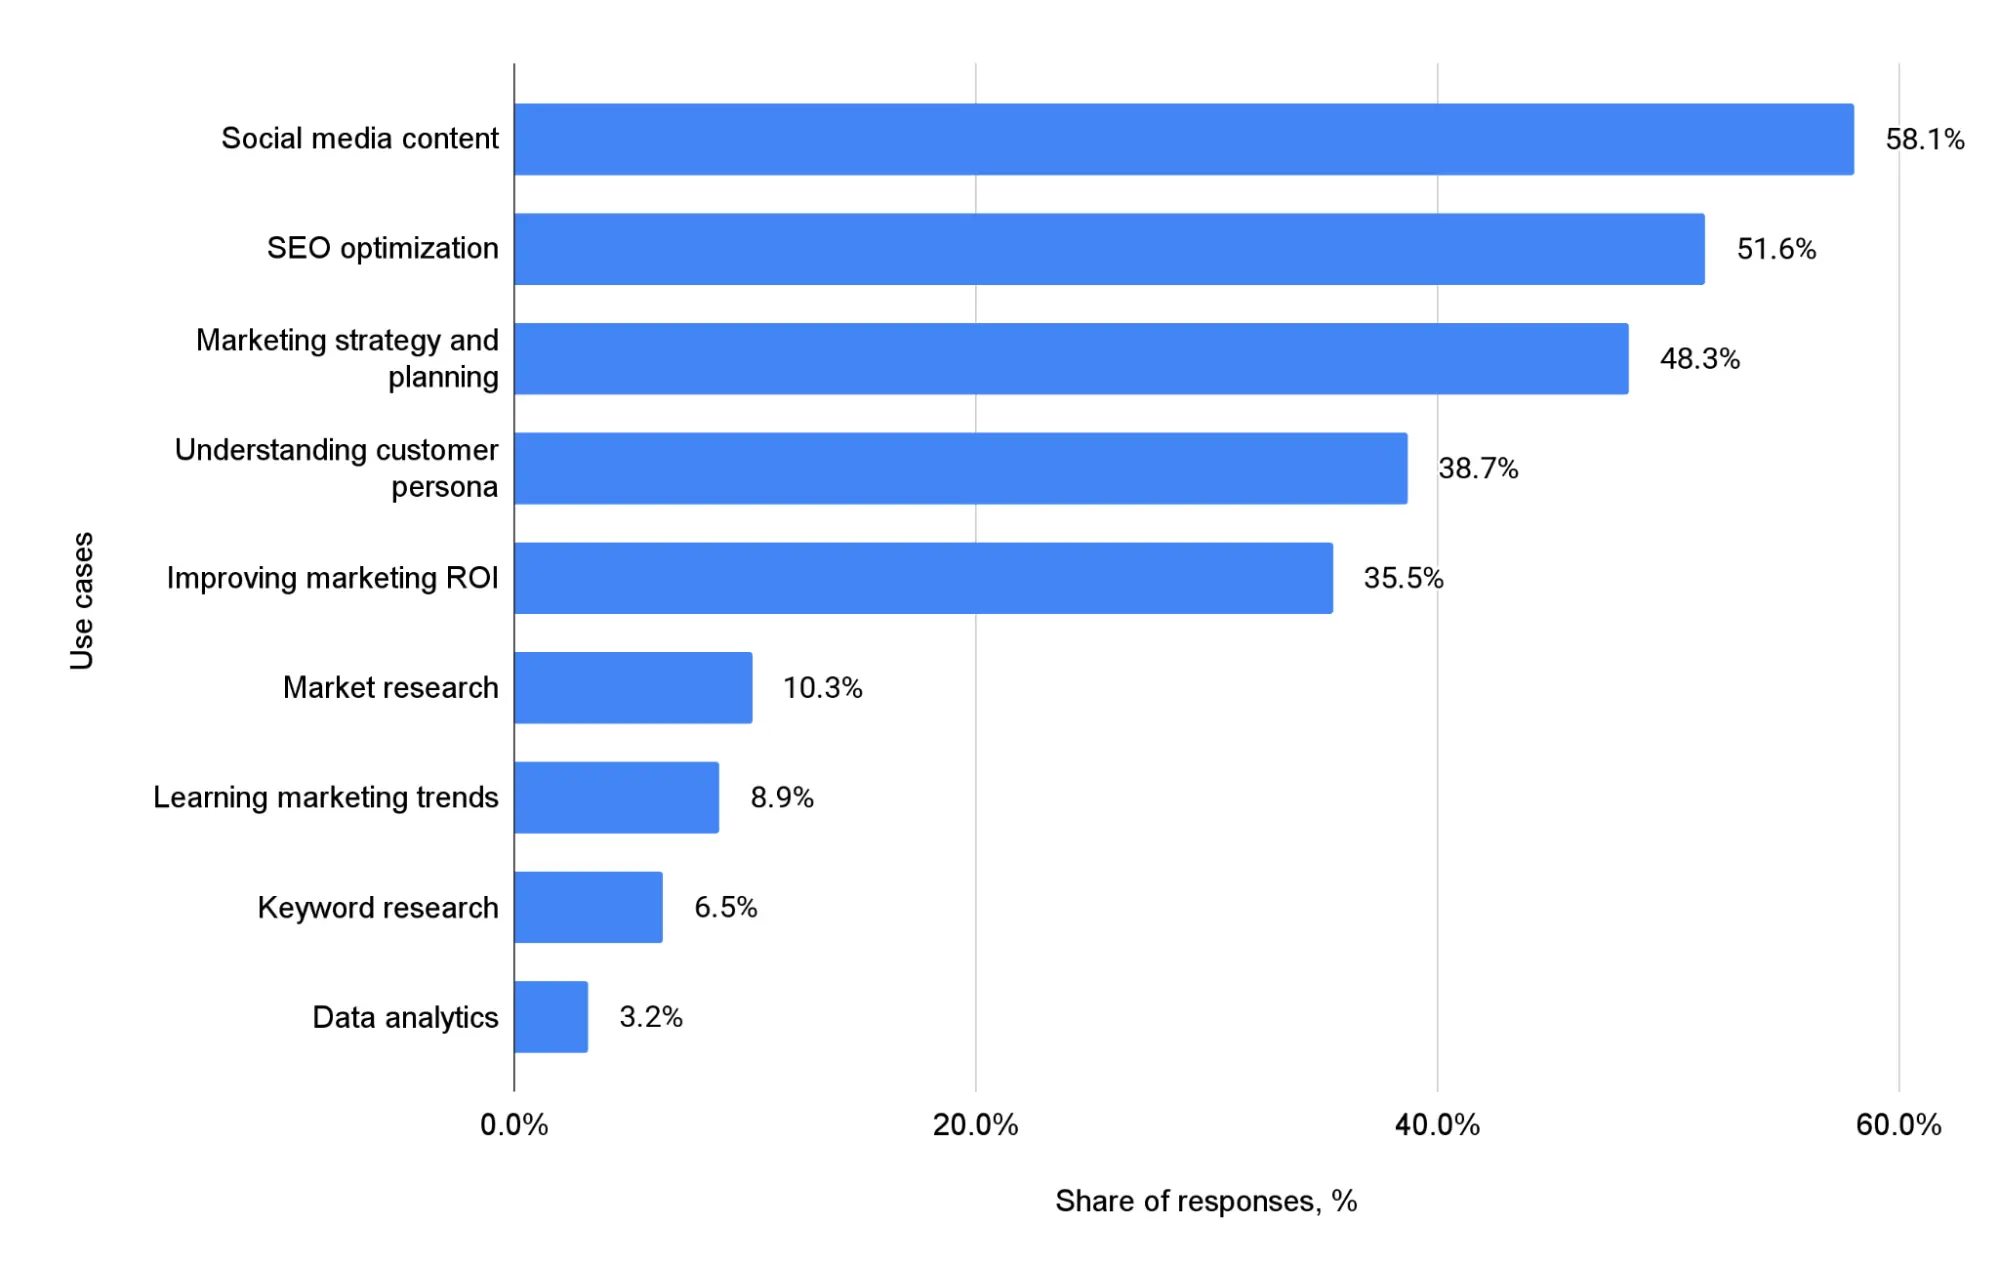
- Social media content is the top marketing use case at 58.1%, making it the most common application of AI tools in this dataset.
- SEO optimization ranks second at 51.6%, narrowly ahead of marketing strategy and planning at 48.3% (a 3.3 percentage point gap).
- AI usage is highly uneven across tasks: data analytics is only 3.2%, and keyword research is 6.5%, compared with 38.7% for understanding customer persona.
AI in workplace examples: How marketing teams use AI most
Overall, these AI in the workplace statistics suggest marketing adoption is concentrated around content production and strategic support, rather than technical analytics. The strongest signals point to AI being used where it can accelerate output and ideation, areas that directly translate into visible benefits of AI in the workplace.
After seeing how marketing teams apply AI across campaigns and strategy, it’s worth zooming in on content creation specifically, where AI often delivers the most immediate value.
Top content creation use-cases for AI tools
This chart breaks down the most common AI use cases across content creation workflows. It provides concrete AI in workplace examples that explain why adoption is accelerating in writing-heavy roles. These categories also reflect some of the most visible benefits of AI in the workplace, from faster research to better ideation.

- Conducting research is the top use case at 76.9%, making it the most common way AI supports content creation.
- Content ideation follows at 69.2%, which is 7.7 percentage points lower than research (76.9% vs 69.2%).
- While content writing is still high at 61.5%, content promotion is much lower at 15.4%, a 46.1 percentage point gap.
How workers use AI at work: AI-powered content creation tasks
These AI in the workplace statistics show that AI is most heavily used in the early stages of content production, research, and ideation, where it can reduce time-to-draft and increase creative throughput. Editing and proofreading also show meaningful adoption, suggesting AI is supporting quality control as well as speed. For journalists, these are clear AI in workplace examples that demonstrate why employees using AI at work often report strong productivity gains, and why these patterns may shape AI workplace usage trends by year as content workloads scale.
After content-focused workflows like research and writing, software development shows another high-impact area where AI is being applied in more technical, execution-driven tasks.
Top software development use-cases for AI tools
This chart summarizes the most common AI use cases in software development, showing where developers get the most value from AI assistance. It complements how workers use AI at work statistics by highlighting developer-specific workflows such as debugging and code suggestion. These patterns also illustrate the practical benefits of AI in the workplace, especially for accelerating repetitive engineering tasks.
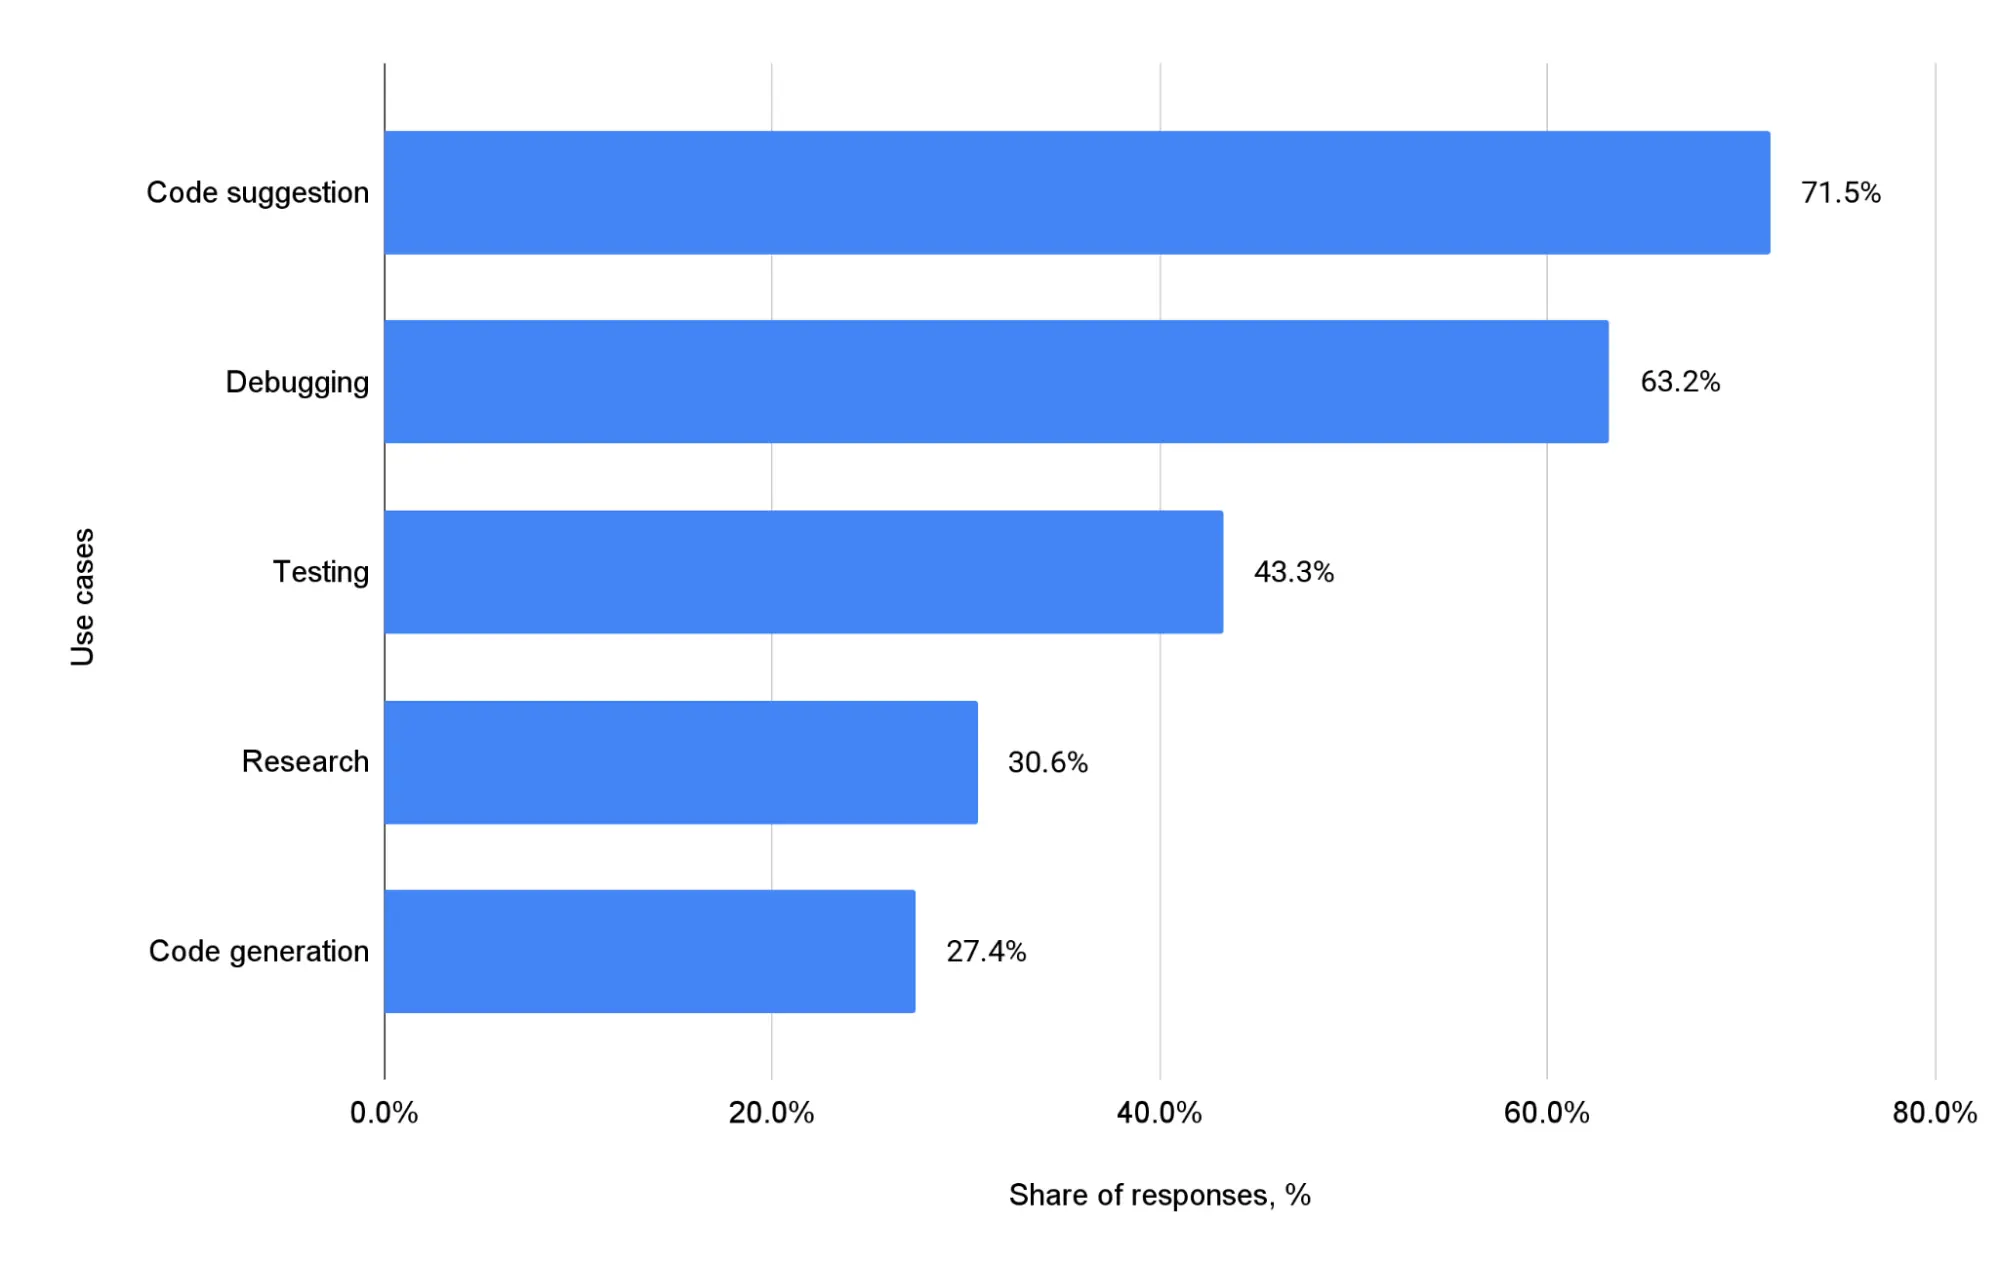
- Code suggestion is the leading use case at 71.5%, making it the most common way developers apply AI tools.
- Debugging is also widely used at 63.2%, just 8.3 percentage points behind code suggestion (71.5% vs 63.2%).
- Code generation sits at 27.4%, which is 44.1 percentage points lower than code suggestion (71.5% vs 27.4%).
AI in workplace examples: How developers use AI most
These AI in the workplace statistics suggest that developers primarily use AI as a real-time assistant inside the coding workflow, rather than relying on it for full end-to-end code production. The high adoption of code suggestion and debugging indicates that AI’s strongest value is in speed and problem-solving support.
After seeing how developers use AI to speed up technical workflows, customer support shows how AI is being applied in high-volume, customer-facing operations.
Top customer support use-cases for AI tools
This chart highlights the most common AI use cases in customer support, focusing on how agents apply AI in real interactions. It strengthens how workers use AI at work statistics by showing that adoption is concentrated in frontline productivity tasks. These are also some of the clearest AI in workplace examples tied to faster response times and improved service consistency.

- Writing response queries is the top use case at 71.5%, making it the most common customer support application of AI tools.
- Understanding customer queries ranks second at 63.2%, just 8.3 percentage points behind writing responses (71.5% vs 63.2%).
- Analyzing customer feedback is much less common at 19.0%, which is 52.5 percentage points lower than writing response queries (71.5% vs 19.0%).
How workers use AI at work: AI adoption in customer support
These AI in the workplace statistics suggest customer support teams use AI primarily for real-time assistance during conversations, rather than for back-office analysis. The heavy emphasis on writing responses and understanding queries aligns with the most immediate benefits of AI in the workplace: speed, consistency, and reduced agent workload.
After mapping the most common AI use cases across roles, the next question is what employees actually get out of it, especially in terms of measurable performance outcomes.
How using AI tools affected employees’ work quality
This chart shows how employees evaluate the impact of AI tools on their work quality. It supports AI productivity statistics by translating AI usage into perceived improvements rather than just adoption rates. The split between minor and significant gains also helps frame how AI increases productivity in the workplace in practical terms.

- A majority of respondents report significant improvements in work quality at 51.6%.
- 48.4% report only minor improvements, meaning the results are nearly evenly split across the two impact levels.
- The difference between significant and minor improvement is just 3.2 percentage points (51.6% vs 48.4%), indicating broadly consistent perceived value.
AI productivity gains: Reported improvements in work quality
Overall, these AI productivity statistics suggest that AI tools are not just saving time; they are improving output quality for most users. With over half reporting significant improvements, the results align with the broader narrative around AI productivity gains and rising expectations for AI-enabled performance. This also supports continued AI productivity growth, as quality improvements often reinforce repeat usage and wider adoption across teams.
Beyond quality improvements, one of the clearest signals of AI productivity gains is whether AI tools actually save employees measurable time.
Time savings due to AI usage
This chart connects AI usage frequency with reported time savings over the previous week. It adds depth to AI productivity statistics by showing how time savings scale as AI becomes more routine. In other words, it helps quantify how AI increases productivity in the workplace through the weekly time recovered.

- Among every workday AI users, 33.5% report saving 4 or more hours, compared with 11.5% for those who used AI on 1 workday.
- In the overall usage results, the most common outcome is saving 1 hour or less (33.0%), while 20.5% report saving 4 or more hours.
- Workers using AI 2-4 workdays per week most frequently report saving 2 hours (33.9%), which is 13.8 percentage points higher than the same category for every workday users (20.1%).
AI productivity statistics: How much time workers save with AI
These AI productivity statistics show a clear relationship between consistency of AI use and the likelihood of larger time savings. Daily AI users are far more likely to report saving four or more hours per week, reinforcing the idea that adoption depth matters as much as adoption breadth. This pattern supports the broader narrative around AI productivity gains and sustained AI productivity growth, since time savings are one of the strongest drivers of continued AI use across teams.
After looking at employee-level productivity gains, it’s important to zoom out and assess how broadly the implementation of AI is progressing across organizations.
AI use across global businesses
This chart summarizes AI use across global businesses, separating companies that are fully operational with AI from those still experimenting or exploring. It provides a clean snapshot of company AI adoption and helps contextualize the current AI implementation rate at the business level. This view also supports broader discussions about scaling AI from individual productivity to enterprise-wide transformation.

- 77% of businesses report they are using or exploring AI, showing that AI engagement is already widespread.
- Only 33% say they are using AI in full operations, indicating that full-scale deployment is still far from universal.
- The gap between exploration and full operations is 44 percentage points (77% vs 33%), highlighting the difference between experimentation and mature implementation.
Company AI adoption: From exploration to full operations
These results suggest that while company AI adoption is now mainstream, full production-level implementation of AI remains a smaller subset of organizations. The large gap between “using or exploring” and “full operations” implies that many companies are still in the readiness and scaling phase, where governance, integration, and talent become limiting factors. This also frames why topics like AI skills gap statistics and demand for AI talents are increasingly central to the next stage of adoption.
Even when businesses are actively adopting AI, the next critical question is whether they have the strategy and readiness required to scale it effectively.
AI adoption and planning across global businesses
This chart compares the share of companies already using AI with the share that report having a clear AI plan. It helps quantify the maturity gap behind company AI adoption and the real-world AI implementation rate. The contrast also offers a useful lens for evaluating how structured the implementation of AI is across global businesses.

- 44% of companies report using AI, indicating adoption is already substantial at the business level.
- Only 22% say they have a clear AI plan, meaning structured planning lags behind usage.
- The difference between AI usage and clear planning is 22 percentage points (44% vs 22%), showing that only about half of the prevalence is matched by strategy.
Company AI adoption vs strategy: Who has a clear AI plan?
These results suggest that many organizations are moving into AI without a fully defined roadmap, which can slow or complicate long-term scaling.
Conclusions
- By the mid-2020s, AI at work has moved beyond early experimentation and into mainstream daily usage. With 86.7% of workers reporting AI use for day-to-day tasks, workplace AI is increasingly becoming a routine layer in how teams operate rather than a niche capability.
- A defining feature of this stage is adoption depth, not just adoption breadth. Usage intensity is already high, with 84.7% of workers using AI at least weekly (46.2% a few times a week and 38.5% every day), showing that AI is being integrated into recurring workflows rather than used occasionally.
- At the same time, global diffusion remains uneven, reinforcing that AI maturity depends heavily on geography. In H2 2025, AI diffusion ranges from 64.0% in the UAE and 60.9% in Singapore to 28.3% in the United States, indicating large cross-country differences in workplace AI penetration.
- Functionally, workers are using AI primarily as a productivity and support layer rather than a replacement for human work. The leading purposes, boosting efficiency (67%) and information access (61%), show that AI is delivering value through speed and knowledge enablement, while innovation (59%) and work quality (58%) remain closely aligned benefits.
- Looking ahead, scaling AI will depend on execution maturity, not just tool availability. Despite strong outcomes (51.6% report significant work-quality improvements and daily users are far more likely to save 4+ hours per week at 33.5%), the adoption curve is constrained by low trust in AI companies (67.7% “No”) and a clear training gap (only 13% offered training vs 55% wanting more), making readiness and governance the defining priorities of the next phase.
Sources
- https://www.goodfirms.co/resources/ai-in-the-workplace. Accessed 24 January 2026.
- Agbai, Chike. “AI in the Workplace Statistics 2026 | Adoption, Impact & Trends.” Azumo Software Development Company Logo in White Letters, 23 Jan. 2026, https://azumo.com/artificial-intelligence/ai-insights/ai-in-workplace-statistics. Accessed 24 January 2026.
- Bick, Alexander. “The Impact of Generative AI on Work Productivity.” Federal Reserve Bank of St. Louis, https://www.stlouisfed.org/on-the-economy/2025/feb/impact-generative-ai-work-productivity. Accessed 24 January 2026.
- Chan, Elton. “AI in the Workplace Statistics and Trends for 2026 | Second Talent.” Second Talent, 1 Dec. 2025, https://www.secondtalent.com/resources/ai-in-the-workplace-statistics-and-trends/. Accessed 24 January 2026.
- “Global AI Adoption in 2025 – AI Economy Institute | Microsoft.” Microsoft Corporate Responsibility, 8 Jan. 2026, https://www.microsoft.com/en-us/corporate-responsibility/topics/ai-economy-institute/reports/global-ai-adoption-2025/. Accessed 24 January 2026.


 Built-in AI detector